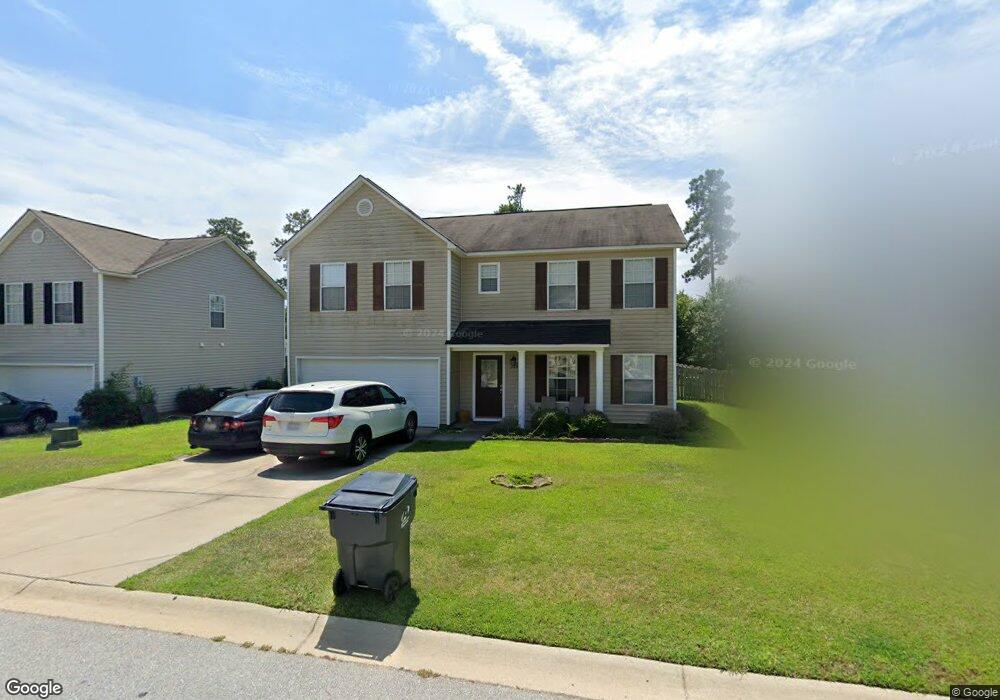
128 Wingspan Way Chapin, SC 29036
Estimated Value: $286,000 - $296,425
5
Beds
4
Baths
2,184
Sq Ft
$134/Sq Ft
Est. Value
About This Home
This home is located at 128 Wingspan Way, Chapin, SC 29036 and is currently estimated at $291,856, approximately $133 per square foot. 128 Wingspan Way is a home located in Lexington County with nearby schools including Chapin Elementary School, Chapin Intermediate, and Chapin High School.
Ownership History
Date
Name
Owned For
Owner Type
Purchase Details
Closed on
Sep 13, 2017
Sold by
Bishop David Q and Bishop Collette M
Bought by
Dennis Tory T and Dennis Bradleigh
Current Estimated Value
Home Financials for this Owner
Home Financials are based on the most recent Mortgage that was taken out on this home.
Original Mortgage
$166,666
Interest Rate
3.88%
Mortgage Type
New Conventional
Purchase Details
Closed on
Jul 25, 2013
Sold by
York Wesley G
Bought by
Bishop David Q and Bishop Collette M
Home Financials for this Owner
Home Financials are based on the most recent Mortgage that was taken out on this home.
Original Mortgage
$151,449
Interest Rate
4.29%
Mortgage Type
VA
Purchase Details
Closed on
Nov 14, 2006
Sold by
Firstar Homes Inc
Bought by
York Wesley G
Home Financials for this Owner
Home Financials are based on the most recent Mortgage that was taken out on this home.
Original Mortgage
$153,258
Interest Rate
5.66%
Mortgage Type
FHA
Create a Home Valuation Report for This Property
The Home Valuation Report is an in-depth analysis detailing your home's value as well as a comparison with similar homes in the area
Home Values in the Area
Average Home Value in this Area
Purchase History
| Date | Buyer | Sale Price | Title Company |
|---|---|---|---|
| Dennis Tory T | $165,000 | None Available | |
| Bishop David Q | $147,900 | -- | |
| York Wesley G | $155,664 | None Available |
Source: Public Records
Mortgage History
| Date | Status | Borrower | Loan Amount |
|---|---|---|---|
| Previous Owner | Dennis Tory T | $166,666 | |
| Previous Owner | Bishop David Q | $151,449 | |
| Previous Owner | York Wesley G | $153,258 |
Source: Public Records
Tax History Compared to Growth
Tax History
| Year | Tax Paid | Tax Assessment Tax Assessment Total Assessment is a certain percentage of the fair market value that is determined by local assessors to be the total taxable value of land and additions on the property. | Land | Improvement |
|---|---|---|---|---|
| 2024 | $1,107 | $6,718 | $1,000 | $5,718 |
| 2023 | $1,028 | $6,718 | $1,000 | $5,718 |
| 2022 | $1,037 | $6,718 | $1,000 | $5,718 |
| 2020 | $1,086 | $6,718 | $1,000 | $5,718 |
| 2019 | $1,085 | $6,600 | $1,000 | $5,600 |
| 2018 | $955 | $6,600 | $1,000 | $5,600 |
| 2017 | $835 | $5,916 | $1,000 | $4,916 |
| 2016 | $856 | $5,916 | $1,000 | $4,916 |
| 2014 | $853 | $5,916 | $1,000 | $4,916 |
| 2013 | -- | $6,100 | $1,000 | $5,100 |
Source: Public Records
Map
Nearby Homes
- 814 Dutchmaster Dr
- 1431 Saugus Ct
- 147 Stuck's Point
- 117 Bay Front Dr
- 510 Lilypad Ct
- 153 Rushton Dr
- 1533 Saugus Ct
- 368 Frick Ct
- 668 Clipper Trail
- 660 Clipper Trail
- 720 Topline St
- 100 Palm St
- 366 Gallery Cliff Dr
- 228 Bickley View Ct
- 339 Newberg Rd
- 129 Monroe Preserve Dr
- 0 Dreher Island Rd Unit 21647709
- 0 Dreher Island Rd Unit 587193
- 0 Mainsail Ln Unit 622256
- 634 Basalt Ct
- 132 Wingspan Way
- 124 Wingspan Way
- 136 Wingspan Way
- 120 Wingspan Way
- 215 Eagle Pointe Dr
- 217 Eagle Pointe Dr
- 213 Eagle Pointe Dr
- 129 Wingspan Way
- 219 Eagle Pointe Dr
- 211 Eagle Pointe Dr
- 140 Wingspan Way
- 116 Wingspan Way
- 125 Wingspan Way
- 133 Wingspan Way
- 121 Wingspan Way
- 137 Wingspan Way
- 209 Eagle Pointe Dr
- 221 Eagle Pointe Dr
- 144 Wingspan Way
- 112 Wingspan Way