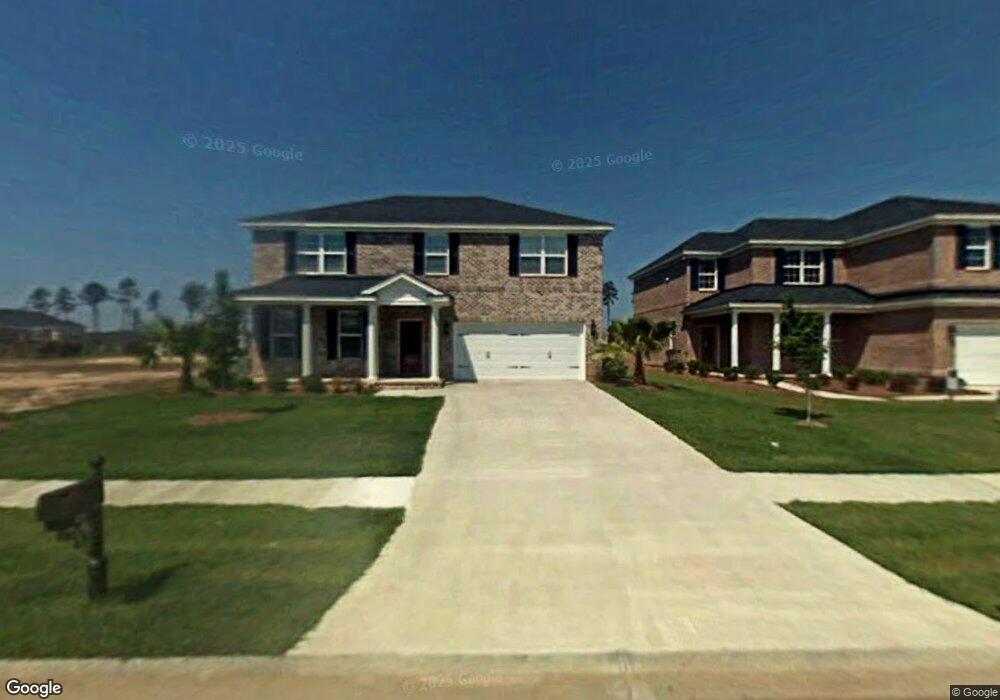
128 Winslow Cir Port Wentworth, GA 31407
Godley Station NeighborhoodEstimated Value: $374,025 - $473,000
4
Beds
4
Baths
2,829
Sq Ft
$147/Sq Ft
Est. Value
About This Home
This home is located at 128 Winslow Cir, Port Wentworth, GA 31407 and is currently estimated at $417,256, approximately $147 per square foot. 128 Winslow Cir is a home located in Chatham County with nearby schools including Godley Station School, Groves High School, and Savannah Adventist Christian School.
Ownership History
Date
Name
Owned For
Owner Type
Purchase Details
Closed on
Aug 31, 2017
Sold by
Thompson Eric
Bought by
Ah4r Properties Llc
Current Estimated Value
Purchase Details
Closed on
Mar 15, 2011
Sold by
Federal National Mortgage Association
Bought by
Thompson Eric A and Thompson Gosia
Home Financials for this Owner
Home Financials are based on the most recent Mortgage that was taken out on this home.
Original Mortgage
$209,629
Interest Rate
4.95%
Mortgage Type
VA
Purchase Details
Closed on
Jul 6, 2010
Sold by
Wells Fargo Bank
Bought by
Federal National Mtg Associati
Purchase Details
Closed on
Jan 31, 2008
Sold by
Not Provided
Bought by
Thompson Eric A and Thompson Gosia
Home Financials for this Owner
Home Financials are based on the most recent Mortgage that was taken out on this home.
Original Mortgage
$270,350
Interest Rate
6.06%
Mortgage Type
New Conventional
Create a Home Valuation Report for This Property
The Home Valuation Report is an in-depth analysis detailing your home's value as well as a comparison with similar homes in the area
Home Values in the Area
Average Home Value in this Area
Purchase History
| Date | Buyer | Sale Price | Title Company |
|---|---|---|---|
| Ah4r Properties Llc | $250,000 | -- | |
| Thompson Eric A | $215,000 | -- | |
| Thompson Eric A | $215,000 | -- | |
| Federal National Mtg Associati | $217,261 | -- | |
| Wells Fargo Bank | $217,261 | -- | |
| Thompson Eric A | -- | -- |
Source: Public Records
Mortgage History
| Date | Status | Borrower | Loan Amount |
|---|---|---|---|
| Previous Owner | Thompson Eric A | $209,629 | |
| Previous Owner | Thompson Eric A | $270,350 |
Source: Public Records
Tax History Compared to Growth
Tax History
| Year | Tax Paid | Tax Assessment Tax Assessment Total Assessment is a certain percentage of the fair market value that is determined by local assessors to be the total taxable value of land and additions on the property. | Land | Improvement |
|---|---|---|---|---|
| 2025 | $4,551 | $144,480 | $18,000 | $126,480 |
| 2024 | $4,551 | $143,440 | $18,000 | $125,440 |
| 2023 | $1,581 | $129,600 | $14,000 | $115,600 |
| 2022 | $1,446 | $118,520 | $14,000 | $104,520 |
| 2021 | $4,474 | $103,000 | $14,000 | $89,000 |
| 2020 | $3,154 | $101,360 | $14,000 | $87,360 |
| 2019 | $3,772 | $99,880 | $14,000 | $85,880 |
| 2018 | $3,049 | $96,560 | $14,000 | $82,560 |
| 2017 | $2,494 | $91,880 | $14,000 | $77,880 |
| 2016 | $2,648 | $90,760 | $14,000 | $76,760 |
| 2015 | $3,763 | $90,240 | $14,000 | $76,240 |
| 2014 | $5,006 | $90,240 | $0 | $0 |
Source: Public Records
Map
Nearby Homes
- 129 Winslow Cir
- 101 Sedona Dr
- 42 Winslow Cir
- 112 Redrock Ct
- 75 Redwall Cir
- 89 Telford St
- 58 Winslow Cir
- 100 Cumberland Way
- 86 Winslow Cir
- 105 Telford St
- 74 Winslow Cir
- 125 Grimsby Rd
- 9 Saddle St N
- 141 Grimsby Rd
- 123 Telford St
- 109 Claystone Ct
- 105 Grimsby Rd
- 107 Willow Point Cir
- 136 Whitehaven Rd
- 7 Bridlington Way
- 128 Winslow Cir
- 128 Winslow Cir
- 126 Winslow Cir
- 126 Winslow Cir
- 130 Winslow Ct
- 130 Winslow Cir
- 124 Winslow Cir
- 132 Winslow Cir
- 132 Winslow Cir
- 124 Winslow Cir
- 127 Winslow Cir
- 129 Winslow Cir
- 122 Winslow Cir
- 125 Winslow Cir
- 131 Winslow Cir
- 125 Winslow Cir
- 134 Winslow Cir
- 134 Winslow Cir
- 133 Winslow Cir
- 123 Winslow Cir