1280 Township Cir Alpharetta, GA 30004
Estimated Value: $453,000 - $524,112
4
Beds
3
Baths
2,377
Sq Ft
$212/Sq Ft
Est. Value
About This Home
This home is located at 1280 Township Cir, Alpharetta, GA 30004 and is currently estimated at $503,778, approximately $211 per square foot. 1280 Township Cir is a home located in Forsyth County with nearby schools including Brandywine Elementary School, DeSana Middle School, and Denmark High School.
Ownership History
Date
Name
Owned For
Owner Type
Purchase Details
Closed on
Sep 15, 2022
Sold by
Gandhi Hemal Amit
Bought by
Gandhi Hemal Amit and Gandhi Surekhaben J
Current Estimated Value
Purchase Details
Closed on
Aug 11, 2016
Sold by
Sathyaraj
Bought by
Pitts Evan Wayne
Home Financials for this Owner
Home Financials are based on the most recent Mortgage that was taken out on this home.
Original Mortgage
$279,837
Interest Rate
3.25%
Mortgage Type
FHA
Purchase Details
Closed on
Jul 31, 2014
Sold by
Radhakrishnan Sathyaraj
Bought by
Radhakrishnan Sathyaraj and Ethirajan Subha Priya
Home Financials for this Owner
Home Financials are based on the most recent Mortgage that was taken out on this home.
Original Mortgage
$216,861
Interest Rate
4.16%
Mortgage Type
New Conventional
Purchase Details
Closed on
Jan 31, 2014
Sold by
Brookstone Ventures Llc
Bought by
John Tomas Partners Llc
Purchase Details
Closed on
Sep 13, 2012
Sold by
Herring Holdings Llc
Bought by
Brookstone Ventures Llc
Create a Home Valuation Report for This Property
The Home Valuation Report is an in-depth analysis detailing your home's value as well as a comparison with similar homes in the area
Home Values in the Area
Average Home Value in this Area
Purchase History
| Date | Buyer | Sale Price | Title Company |
|---|---|---|---|
| Gandhi Hemal Amit | -- | -- | |
| Pitts Evan Wayne | $285,000 | -- | |
| Radhakrishnan Sathyaraj | -- | -- | |
| Radhakrishnan Sathyaraj | $228,275 | -- | |
| Jtp Sl Llc | -- | -- | |
| John Tomas Partners Llc | $150,000 | -- | |
| Brookstone Ventures Llc | $1,997,500 | -- |
Source: Public Records
Mortgage History
| Date | Status | Borrower | Loan Amount |
|---|---|---|---|
| Previous Owner | Pitts Evan Wayne | $279,837 | |
| Previous Owner | Jtp Sl Llc | $216,861 |
Source: Public Records
Tax History Compared to Growth
Tax History
| Year | Tax Paid | Tax Assessment Tax Assessment Total Assessment is a certain percentage of the fair market value that is determined by local assessors to be the total taxable value of land and additions on the property. | Land | Improvement |
|---|---|---|---|---|
| 2025 | $4,821 | $217,648 | $78,000 | $139,648 |
| 2024 | $4,821 | $217,352 | $66,000 | $151,352 |
| 2023 | $3,873 | $184,000 | $49,560 | $134,440 |
| 2022 | $3,956 | $135,760 | $40,000 | $95,760 |
| 2021 | $3,618 | $135,760 | $40,000 | $95,760 |
| 2020 | $3,512 | $130,608 | $40,000 | $90,608 |
| 2019 | $3,505 | $130,036 | $40,000 | $90,036 |
| 2018 | $3,595 | $130,004 | $32,000 | $98,004 |
| 2017 | $3,164 | $114,000 | $27,720 | $86,280 |
| 2016 | $2,738 | $98,640 | $24,000 | $74,640 |
| 2015 | $2,427 | $87,280 | $16,000 | $71,280 |
| 2014 | $424 | $16,000 | $0 | $0 |
Source: Public Records
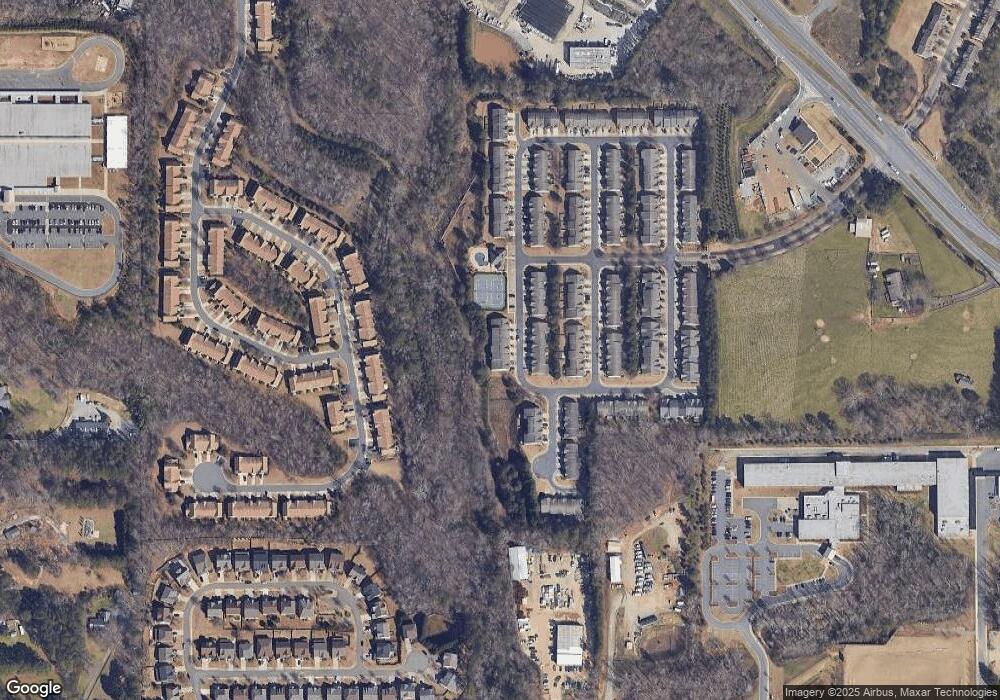
Map
Nearby Homes
- 1550 Township Cir
- 419 Grayson Way
- 368 Grayson Way
- 353 Grayson Way
- 472 Grayson Way
- 409 Windstone Trail
- 406 Weatherstone Place
- 255 White Pines Dr
- 1480 Waverly Glen Dr
- 1620 Woodall View Ct
- 5512 Atlanta Hwy
- 5880 Atlanta Hwy
- 5878 Atlanta Hwy
- 5878A Atlanta Hwy
- 6140 Cameo Ln
- 785 Streamview Way
- 6215 Merrill View Ln
- 1245 Overland Crossing
- 1345 Faircrest Ln
- 1280 Township Cir Unit 1280
- 1270 Township Cir
- 1290 Township Cir Unit 51
- 1290 Township Cir
- 1260 Township Cir
- 1310 Township Cir Unit 52
- 1310 Township Cir
- 1250 Township Cir
- 1285 Township Cir
- 1275 Township Cir
- 1295 Township Cir
- 1265 Township Cir
- 1255 Township Cir
- 1245 Township Cir
- 1235 Township Cir
- 1225 Township Cir
- 1410 Queens Ln
- 780 Middleton Place
- 790 Middleton Place
- 770 Middleton Place