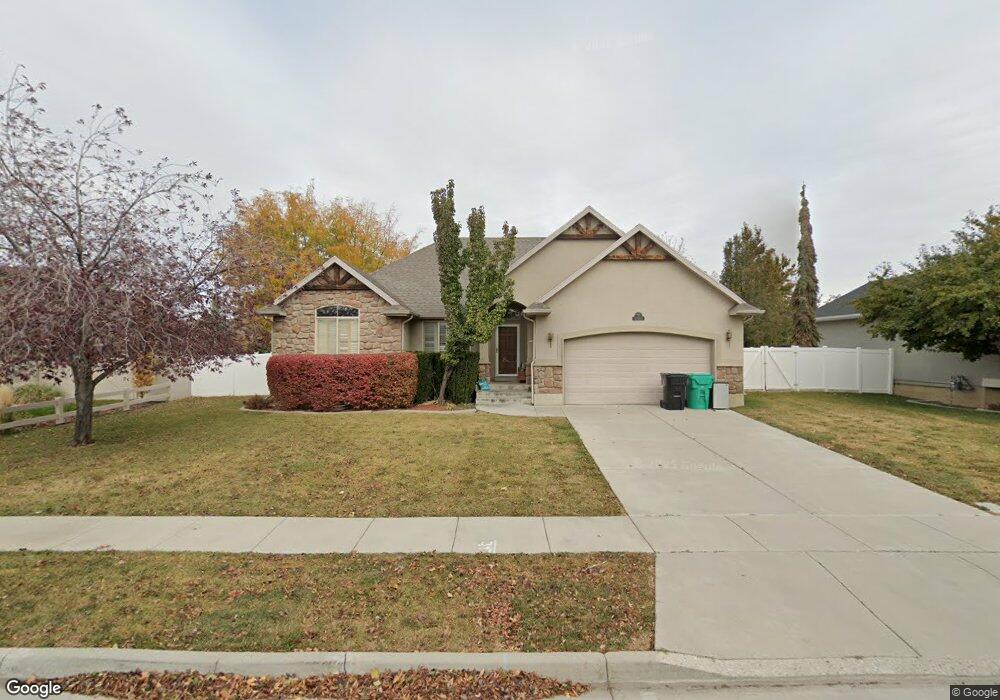
1280 W 2175 S Syracuse, UT 84075
Estimated Value: $462,000 - $578,000
3
Beds
2
Baths
2,876
Sq Ft
$183/Sq Ft
Est. Value
About This Home
This home is located at 1280 W 2175 S, Syracuse, UT 84075 and is currently estimated at $525,757, approximately $182 per square foot. 1280 W 2175 S is a home located in Davis County with nearby schools including Bluff Ridge Elementary, Legacy Junior High School, and Clearfield High School.
Ownership History
Date
Name
Owned For
Owner Type
Purchase Details
Closed on
Apr 19, 2004
Sold by
Destination Homes Inc
Bought by
Brady Randall and Brady Stephanie
Current Estimated Value
Home Financials for this Owner
Home Financials are based on the most recent Mortgage that was taken out on this home.
Original Mortgage
$164,000
Outstanding Balance
$76,692
Interest Rate
5.57%
Mortgage Type
Purchase Money Mortgage
Estimated Equity
$449,065
Purchase Details
Closed on
Apr 30, 2003
Sold by
Hawthorn Llc
Bought by
Destination Homes Inc
Home Financials for this Owner
Home Financials are based on the most recent Mortgage that was taken out on this home.
Original Mortgage
$81,767
Interest Rate
5.84%
Mortgage Type
Seller Take Back
Create a Home Valuation Report for This Property
The Home Valuation Report is an in-depth analysis detailing your home's value as well as a comparison with similar homes in the area
Home Values in the Area
Average Home Value in this Area
Purchase History
| Date | Buyer | Sale Price | Title Company |
|---|---|---|---|
| Brady Randall | -- | Bonneville Title Company Inc | |
| Destination Homes Inc | -- | Security Title Company |
Source: Public Records
Mortgage History
| Date | Status | Borrower | Loan Amount |
|---|---|---|---|
| Open | Brady Randall | $164,000 | |
| Previous Owner | Destination Homes Inc | $81,767 | |
| Closed | Brady Randall | $20,500 |
Source: Public Records
Tax History Compared to Growth
Tax History
| Year | Tax Paid | Tax Assessment Tax Assessment Total Assessment is a certain percentage of the fair market value that is determined by local assessors to be the total taxable value of land and additions on the property. | Land | Improvement |
|---|---|---|---|---|
| 2025 | $2,696 | $260,150 | $125,024 | $135,126 |
| 2024 | $2,571 | $249,700 | $103,457 | $146,243 |
| 2023 | $2,610 | $462,000 | $144,152 | $317,848 |
| 2022 | $2,800 | $271,700 | $82,972 | $188,728 |
| 2021 | $2,510 | $377,000 | $122,621 | $254,379 |
| 2020 | $2,242 | $326,000 | $106,789 | $219,211 |
| 2019 | $2,187 | $314,000 | $104,414 | $209,586 |
| 2018 | $2,063 | $294,000 | $100,824 | $193,176 |
| 2016 | $1,976 | $147,675 | $38,697 | $108,978 |
| 2015 | $1,945 | $138,435 | $38,697 | $99,738 |
| 2014 | $1,698 | $123,168 | $38,697 | $84,471 |
| 2013 | -- | $122,516 | $38,775 | $83,741 |
Source: Public Records
Map
Nearby Homes