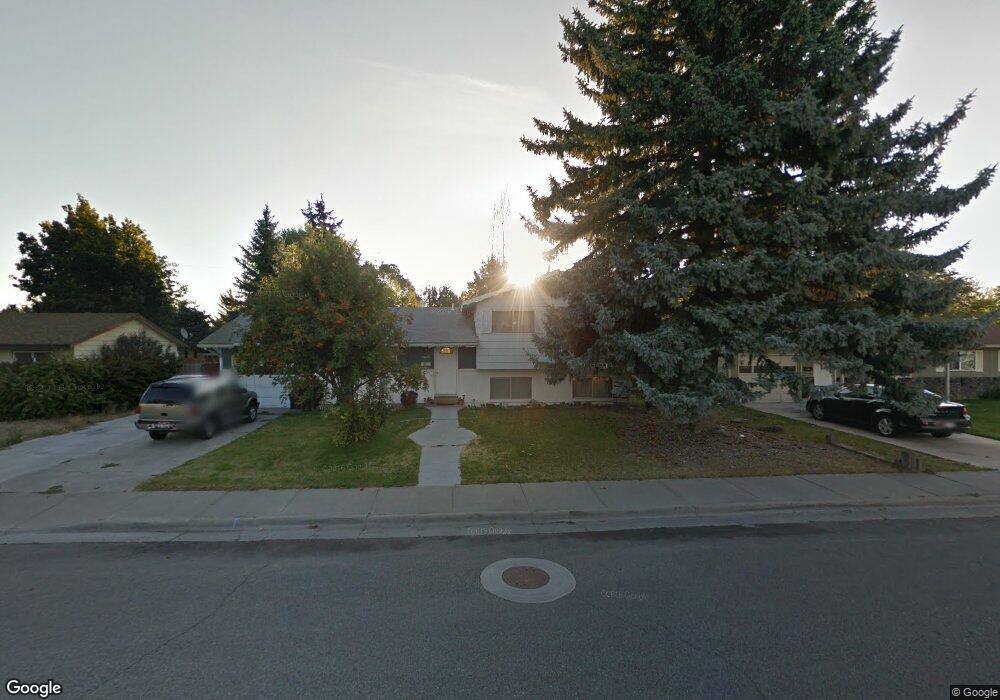
1280 Washburn Ave Idaho Falls, ID 83402
Estimated Value: $314,285 - $362,000
4
Beds
1
Bath
1,682
Sq Ft
$200/Sq Ft
Est. Value
About This Home
This home is located at 1280 Washburn Ave, Idaho Falls, ID 83402 and is currently estimated at $336,071, approximately $199 per square foot. 1280 Washburn Ave is a home located in Bonneville County with nearby schools including Temple View Elementary School, Eagle Rock Middle School, and Skyline Senior High School.
Ownership History
Date
Name
Owned For
Owner Type
Purchase Details
Closed on
May 25, 2022
Sold by
Pearl Properties Llc
Bought by
Warren Rentals Llc
Current Estimated Value
Purchase Details
Closed on
Mar 8, 2018
Sold by
Carlson Dan and Carlson Susan
Bought by
Pearl Properties Llc
Purchase Details
Closed on
Dec 8, 2016
Sold by
Pearl Properties Llc
Bought by
Carlson Dan
Purchase Details
Closed on
Aug 23, 2016
Sold by
Singarajah Thana
Bought by
Carlson Dan
Purchase Details
Closed on
Jun 9, 2014
Sold by
Singarajah Thana
Bought by
Pearl Properties Llc
Purchase Details
Closed on
Apr 6, 2012
Sold by
Burns Casey and Burns Debbie
Bought by
Singarjah Thana
Purchase Details
Closed on
Feb 22, 2010
Sold by
Singararah Thana
Bought by
Burns Casey and Burns Debbie
Home Financials for this Owner
Home Financials are based on the most recent Mortgage that was taken out on this home.
Original Mortgage
$132,000
Interest Rate
5.02%
Mortgage Type
Purchase Money Mortgage
Create a Home Valuation Report for This Property
The Home Valuation Report is an in-depth analysis detailing your home's value as well as a comparison with similar homes in the area
Home Values in the Area
Average Home Value in this Area
Purchase History
| Date | Buyer | Sale Price | Title Company |
|---|---|---|---|
| Warren Rentals Llc | -- | None Listed On Document | |
| Pearl Properties Llc | -- | Amerititle | |
| Carlson Dan | -- | None Available | |
| Carlson Dan | -- | None Available | |
| Pearl Properties Llc | -- | None Available | |
| Singarjah Thana | -- | Titleone Corp | |
| Burns Casey | -- | -- |
Source: Public Records
Mortgage History
| Date | Status | Borrower | Loan Amount |
|---|---|---|---|
| Previous Owner | Burns Casey | $132,000 |
Source: Public Records
Tax History Compared to Growth
Tax History
| Year | Tax Paid | Tax Assessment Tax Assessment Total Assessment is a certain percentage of the fair market value that is determined by local assessors to be the total taxable value of land and additions on the property. | Land | Improvement |
|---|---|---|---|---|
| 2025 | $2,721 | $381,620 | $78,165 | $303,455 |
| 2024 | $2,721 | $335,536 | $53,888 | $281,648 |
| 2023 | $2,672 | $284,868 | $53,888 | $230,980 |
| 2022 | $2,825 | $234,370 | $38,250 | $196,120 |
| 2021 | $2,732 | $170,190 | $38,250 | $131,940 |
| 2019 | $2,447 | $148,243 | $31,883 | $116,360 |
| 2018 | $2,260 | $137,098 | $28,958 | $108,140 |
| 2017 | $2,046 | $120,105 | $25,425 | $94,680 |
| 2016 | $1,951 | $109,755 | $23,085 | $86,670 |
| 2015 | $1,917 | $102,405 | $23,085 | $79,320 |
| 2014 | $44,271 | $102,405 | $23,085 | $79,320 |
| 2013 | $1,907 | $105,205 | $23,085 | $82,120 |
Source: Public Records
Map
Nearby Homes
- 1215 Cameron Ave
- 1274 Norton Ave
- 1711 Whitney St
- 1758 Peggys Ln
- 1640 Whitney St
- 1076 Singletree Cir
- 1970 Peggys Ln
- 862 Raymond Dr
- 885 N Skyline Dr
- 1873 Charlene St
- 837 Dalmation Dr
- 867 Coachman Dr
- 847 Claire View Ln
- 863 Coachman Dr
- 1573 Beverly Rd
- 1743 Raymond Dr
- 1463 Vega Cir Unit 1
- 403 Evans Ave
- 604 Neptune Dr
- 1480 Scorpius Dr
- 1258 Washburn Ave
- 1302 Washburn Ave
- 1302 Washburn Ave
- 1240 Washburn Ave
- 1285 Corinne Ave
- 1259 Corinne Ave
- 1259 Corrine Ave
- 1332 Washburn Ave
- 1309 Corrine Ave
- 1255 Washburn Ave
- 1311 Washburn Ave
- 1239 Corrine Ave
- 1340 Washburn Ave
- 1325 Corrine Ave
- 1220 Washburn Ave
- 1897 Everest St
- 1219 Corrine Ave
- 1900 Everest St
- 1335 Washburn Ave