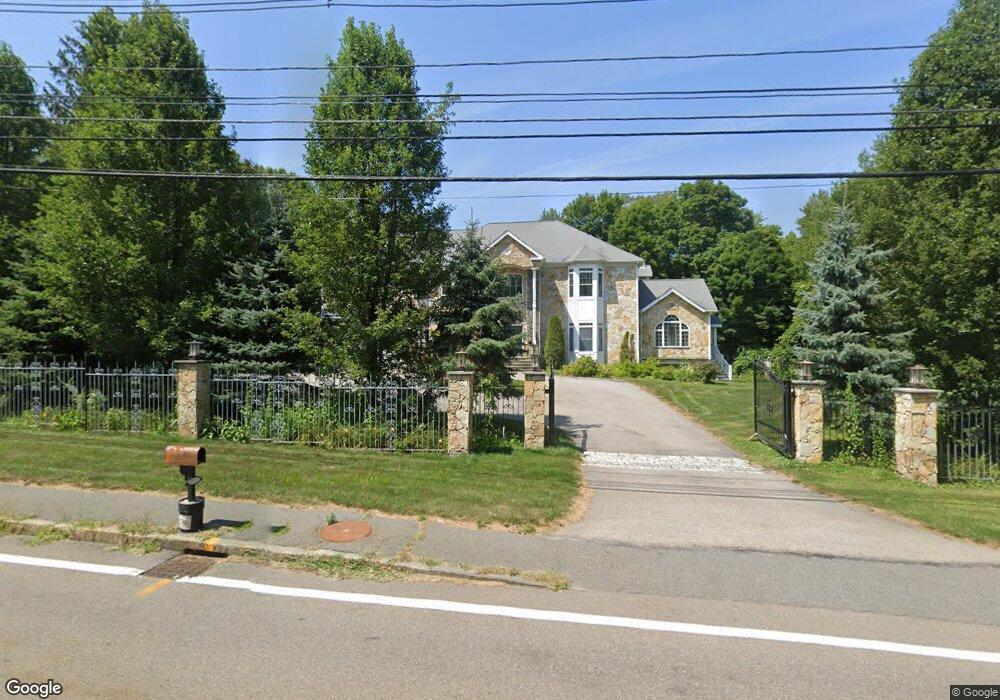
1280 West St Wrentham, MA 02093
West Wrentham NeighborhoodEstimated Value: $1,120,000 - $1,799,000
4
Beds
5
Baths
5,930
Sq Ft
$251/Sq Ft
Est. Value
About This Home
This home is located at 1280 West St, Wrentham, MA 02093 and is currently estimated at $1,489,152, approximately $251 per square foot. 1280 West St is a home located in Norfolk County with nearby schools including Delaney Elementary School, Charles E Roderick, and Mercymount Country Day School.
Ownership History
Date
Name
Owned For
Owner Type
Purchase Details
Closed on
Jun 4, 2009
Sold by
Krc Business T and Abdel-Fattah Khaled M
Bought by
Daou George H
Current Estimated Value
Home Financials for this Owner
Home Financials are based on the most recent Mortgage that was taken out on this home.
Original Mortgage
$411,000
Interest Rate
4.83%
Mortgage Type
Purchase Money Mortgage
Purchase Details
Closed on
May 5, 2006
Sold by
Abdel-Fattah Khaled M
Bought by
Abdel-Fattah Khaled M
Purchase Details
Closed on
Jul 3, 2003
Sold by
Hemmingsen Robert G and Hemmingsen Nancy L
Bought by
K A L Dev T and Abdel-Fattah Khaled M
Home Financials for this Owner
Home Financials are based on the most recent Mortgage that was taken out on this home.
Original Mortgage
$550,000
Interest Rate
5.46%
Mortgage Type
Purchase Money Mortgage
Create a Home Valuation Report for This Property
The Home Valuation Report is an in-depth analysis detailing your home's value as well as a comparison with similar homes in the area
Home Values in the Area
Average Home Value in this Area
Purchase History
| Date | Buyer | Sale Price | Title Company |
|---|---|---|---|
| Daou George H | $514,000 | -- | |
| Abdel-Fattah Khaled M | -- | -- | |
| K A L Dev T | $199,900 | -- |
Source: Public Records
Mortgage History
| Date | Status | Borrower | Loan Amount |
|---|---|---|---|
| Open | K A L Dev T | $513,000 | |
| Closed | Daou George H | $411,000 | |
| Previous Owner | K A L Dev T | $550,000 |
Source: Public Records
Tax History Compared to Growth
Tax History
| Year | Tax Paid | Tax Assessment Tax Assessment Total Assessment is a certain percentage of the fair market value that is determined by local assessors to be the total taxable value of land and additions on the property. | Land | Improvement |
|---|---|---|---|---|
| 2025 | $15,947 | $1,375,900 | $300,000 | $1,075,900 |
| 2024 | $14,950 | $1,245,800 | $300,000 | $945,800 |
| 2023 | $15,284 | $1,211,100 | $273,900 | $937,200 |
| 2022 | $14,713 | $1,076,300 | $267,100 | $809,200 |
| 2021 | $14,004 | $995,300 | $250,400 | $744,900 |
| 2020 | $14,239 | $999,200 | $194,000 | $805,200 |
| 2019 | $13,335 | $944,400 | $175,800 | $768,600 |
| 2018 | $12,860 | $903,100 | $175,100 | $728,000 |
| 2017 | $12,658 | $888,300 | $171,800 | $716,500 |
| 2016 | $12,522 | $876,900 | $166,800 | $710,100 |
| 2015 | $12,941 | $863,900 | $177,000 | $686,900 |
| 2014 | $12,834 | $838,300 | $170,300 | $668,000 |
Source: Public Records
Map
Nearby Homes