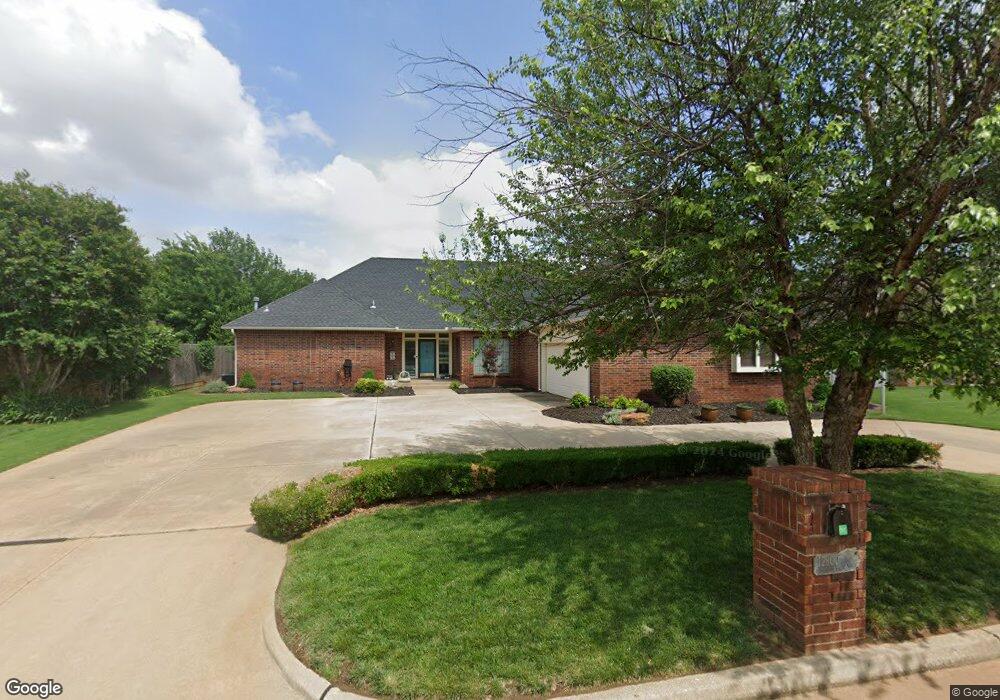
12800 Deerfield Cir Oklahoma City, OK 73142
Val Verde NeighborhoodEstimated Value: $458,658 - $526,000
3
Beds
3
Baths
2,913
Sq Ft
$174/Sq Ft
Est. Value
About This Home
This home is located at 12800 Deerfield Cir, Oklahoma City, OK 73142 and is currently estimated at $505,415, approximately $173 per square foot. 12800 Deerfield Cir is a home located in Oklahoma County with nearby schools including Quail Creek Elementary School, John Marshall Enterprise Middle School, and John Marshall Enterprise High School.
Ownership History
Date
Name
Owned For
Owner Type
Purchase Details
Closed on
Nov 9, 2020
Sold by
Preble Patrick D and Preble Sheila
Bought by
Preble Patrick D and Preble Sheila
Current Estimated Value
Home Financials for this Owner
Home Financials are based on the most recent Mortgage that was taken out on this home.
Original Mortgage
$279,000
Outstanding Balance
$247,366
Interest Rate
2.6%
Mortgage Type
VA
Estimated Equity
$258,049
Purchase Details
Closed on
Nov 9, 1998
Sold by
Andrews Barbara A and Andrews Jerold L
Bought by
Andrews Barbara A and Andrews Jerold L
Purchase Details
Closed on
May 30, 1997
Sold by
Tilley Donald E and Tilley Peggy L
Bought by
Andrews Barbara A
Home Financials for this Owner
Home Financials are based on the most recent Mortgage that was taken out on this home.
Original Mortgage
$21,800
Interest Rate
8.1%
Mortgage Type
Seller Take Back
Create a Home Valuation Report for This Property
The Home Valuation Report is an in-depth analysis detailing your home's value as well as a comparison with similar homes in the area
Home Values in the Area
Average Home Value in this Area
Purchase History
| Date | Buyer | Sale Price | Title Company |
|---|---|---|---|
| Preble Patrick D | -- | Oklahoma Land Title Svcs Llc | |
| Andrews Barbara A | -- | -- | |
| Andrews Barbara A | $220,000 | -- |
Source: Public Records
Mortgage History
| Date | Status | Borrower | Loan Amount |
|---|---|---|---|
| Open | Preble Patrick D | $279,000 | |
| Previous Owner | Andrews Barbara A | $21,800 |
Source: Public Records
Tax History Compared to Growth
Tax History
| Year | Tax Paid | Tax Assessment Tax Assessment Total Assessment is a certain percentage of the fair market value that is determined by local assessors to be the total taxable value of land and additions on the property. | Land | Improvement |
|---|---|---|---|---|
| 2024 | -- | $38,750 | $6,304 | $32,446 |
| 2023 | $0 | $37,621 | $6,517 | $31,104 |
| 2022 | -- | $36,525 | $7,258 | $29,267 |
| 2021 | $0 | $35,462 | $6,696 | $28,766 |
| 2020 | $0 | $34,430 | $7,186 | $27,244 |
| 2019 | $0 | $37,675 | $7,186 | $30,489 |
| 2018 | $0 | $36,685 | $0 | $0 |
| 2017 | $0 | $37,674 | $6,943 | $30,731 |
| 2016 | $0 | $38,719 | $6,943 | $31,776 |
| 2015 | -- | $38,360 | $6,943 | $31,417 |
| 2014 | -- | $38,083 | $6,943 | $31,140 |
Source: Public Records
Map
Nearby Homes
- 12701 Downsview Ln
- 5001 Misty Glen Cir
- 5309 NW 123rd St
- 12308 Val Verde Dr
- 12300 St Lukes Ln
- 5612 NW 126th St
- 5632 NW 126th St
- 13009 Jasmine Ln
- 12220 Banyan Ln
- 13201 Turtle Pond Ct
- 12300 Maiden Ln
- 5609 NW 130th St
- 12909 Saint Christopher Dr
- 12216 Cork Rd
- 5601 NW 133rd Terrace
- 4436 Tamarisk Dr
- 13309 Upper Pond Ct
- 5509 NW 121st St
- 12305 Windsong Way
- 4704 Hemlock Ln
- 12708 Deerfield Cir
- 12809 Val Verde Dr
- 12805 Val Verde Dr
- 12805 Deerfield Cir
- 12809 Deerfield Cir
- 12808 Deerfield Cir
- 12813 Val Verde Dr
- 12813 Deerfield Cir
- 12709 Deerfield Cir
- 12713 Deerfield Cir
- 12705 Deerfield Cir
- 12901 Deerfield Ct
- 12900 Deerfield Cir
- 12716 Downsview Ln
- 12701 Deerfield Cir
- 12812 Val Verde Dr
- 12817 Deerfield Cir
- 12808 Val Verde Dr
- 12725 Downsview Ln
- 12905 Deerfield Ct