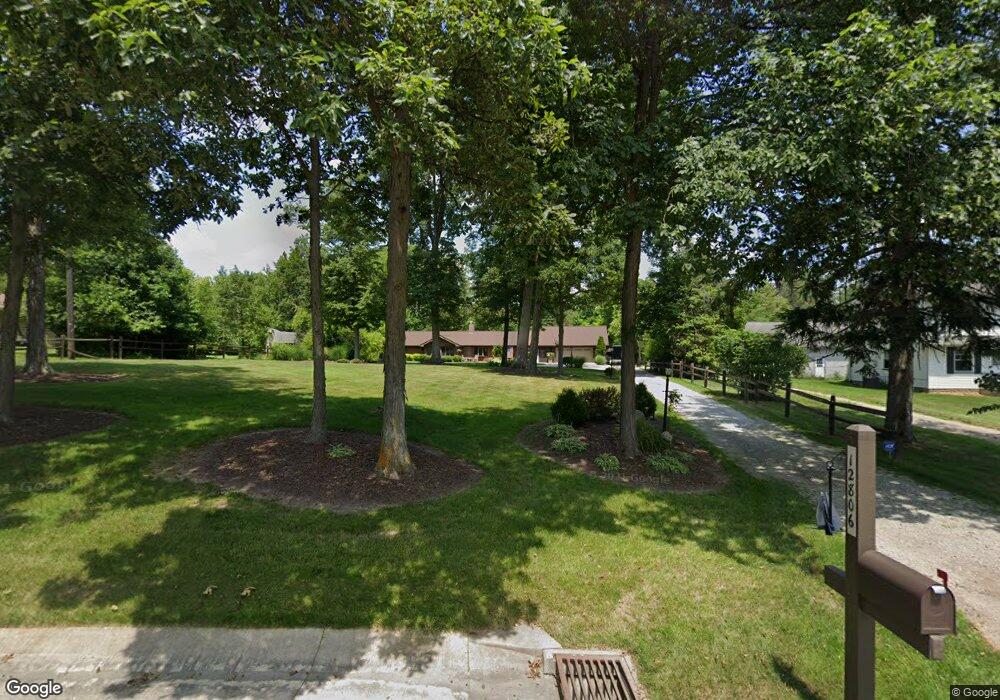
12806 Drake Rd North Royalton, OH 44133
Estimated Value: $320,000 - $375,000
3
Beds
3
Baths
2,178
Sq Ft
$161/Sq Ft
Est. Value
About This Home
This home is located at 12806 Drake Rd, North Royalton, OH 44133 and is currently estimated at $351,000, approximately $161 per square foot. 12806 Drake Rd is a home located in Cuyahoga County with nearby schools including North Royalton Middle School, North Royalton High School, and Royal Redeemer Lutheran School.
Ownership History
Date
Name
Owned For
Owner Type
Purchase Details
Closed on
Jun 20, 2006
Sold by
Conrad Jon D and Conrad Michelle
Bought by
Krutko Michael J and Krutko Ann M
Current Estimated Value
Home Financials for this Owner
Home Financials are based on the most recent Mortgage that was taken out on this home.
Original Mortgage
$33,000
Outstanding Balance
$21,657
Interest Rate
8.75%
Mortgage Type
Fannie Mae Freddie Mac
Estimated Equity
$329,343
Purchase Details
Closed on
Nov 29, 1991
Sold by
Adkins Danny C and Adkins Jeanette S
Bought by
Conrad Jon D
Purchase Details
Closed on
Aug 20, 1984
Sold by
Beeson Ralph M
Bought by
Adkins Danny C and Adkins Jeanette S
Purchase Details
Closed on
Dec 11, 1978
Sold by
Petche James M and Petche Steve
Bought by
Beeson Ralph M
Purchase Details
Closed on
Jan 1, 1975
Bought by
Petche James M and Petche Steve
Create a Home Valuation Report for This Property
The Home Valuation Report is an in-depth analysis detailing your home's value as well as a comparison with similar homes in the area
Home Values in the Area
Average Home Value in this Area
Purchase History
| Date | Buyer | Sale Price | Title Company |
|---|---|---|---|
| Krutko Michael J | $165,000 | Exact | |
| Conrad Jon D | $142,000 | -- | |
| Adkins Danny C | $65,000 | -- | |
| Beeson Ralph M | $64,000 | -- | |
| Petche James M | -- | -- |
Source: Public Records
Mortgage History
| Date | Status | Borrower | Loan Amount |
|---|---|---|---|
| Open | Krutko Michael J | $33,000 | |
| Open | Krutko Michael J | $132,000 |
Source: Public Records
Tax History Compared to Growth
Tax History
| Year | Tax Paid | Tax Assessment Tax Assessment Total Assessment is a certain percentage of the fair market value that is determined by local assessors to be the total taxable value of land and additions on the property. | Land | Improvement |
|---|---|---|---|---|
| 2024 | $6,296 | $108,395 | $13,930 | $94,465 |
| 2023 | $4,893 | $77,250 | $13,830 | $63,420 |
| 2022 | $4,859 | $77,250 | $13,830 | $63,420 |
| 2021 | $4,910 | $77,250 | $13,830 | $63,420 |
| 2020 | $4,343 | $64,930 | $11,620 | $53,310 |
| 2019 | $4,216 | $185,500 | $33,200 | $152,300 |
| 2018 | $4,079 | $64,930 | $11,620 | $53,310 |
| 2017 | $4,160 | $60,550 | $11,900 | $48,650 |
| 2016 | $3,898 | $60,550 | $11,900 | $48,650 |
| 2015 | $3,815 | $60,550 | $11,900 | $48,650 |
| 2014 | $3,815 | $58,800 | $11,550 | $47,250 |
Source: Public Records
Map
Nearby Homes
- 13448 Compass Point Dr
- 13335 Tradewinds Dr
- 18680 Bennett Rd
- 14132 Walking Stick Way
- 14558 Drake Rd
- 19252 Hidden Woods Ln
- 19297 Hunt Rd
- 11886 Friar Post
- 17390 Bennett Rd
- 14292 Trenton Ave
- 11861 W Edgerton Rd
- 18987 Laurell Cir
- 18323 Benbow Rd
- 10244 Hidden Valley Dr
- 10281 River Run Ln
- 14835 Thornton Dr
- 106 Briarleigh Dr
- 20745 Evergreen Trail
- 18229 Howe Rd
- 15188 Trails Landing
- 12766 Drake Rd
- 12832 Drake Rd
- 12754 Drake Rd
- 12840 Drake Rd
- 12742 Drake Rd
- 17535 W 130th St
- 12659 Drake Rd
- 17547 W 130th St
- 12821 Drake Rd
- 12730 Drake Rd
- 17523 W 130th St
- 17505 W 130th St
- 12831 Drake Rd
- 17475 W 130th St
- 12718 Drake Rd
- 12623 Drake Rd
- 12623 Drake Rd
- 17474 W 130th St
- 17512 W 130th St
- 17466 W 130th St