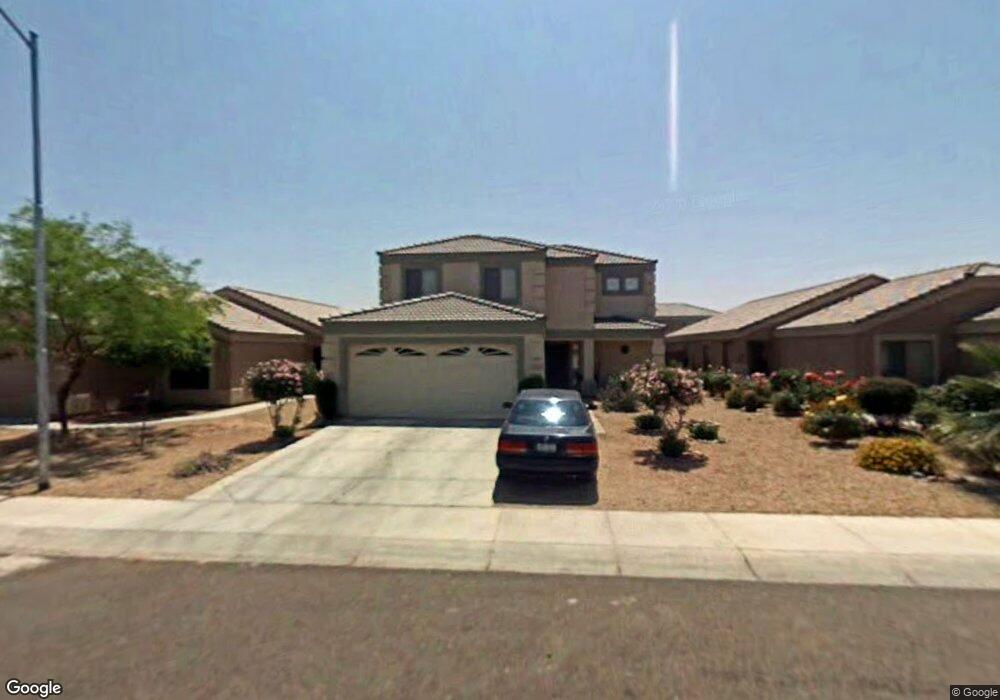
12809 W Pershing St El Mirage, AZ 85335
Estimated Value: $325,070 - $395,000
--
Bed
3
Baths
1,978
Sq Ft
$187/Sq Ft
Est. Value
About This Home
This home is located at 12809 W Pershing St, El Mirage, AZ 85335 and is currently estimated at $369,268, approximately $186 per square foot. 12809 W Pershing St is a home located in Maricopa County with nearby schools including El Mirage Elementary School, Dysart Middle School, and Dysart High School.
Ownership History
Date
Name
Owned For
Owner Type
Purchase Details
Closed on
Dec 4, 2003
Sold by
Rocha Eleacer
Bought by
Rocha Eleacer and Rocha Maria S
Current Estimated Value
Purchase Details
Closed on
Jan 23, 2003
Sold by
Rocha Marie Soledad
Bought by
Rocha Eleacer
Home Financials for this Owner
Home Financials are based on the most recent Mortgage that was taken out on this home.
Original Mortgage
$104,112
Outstanding Balance
$43,800
Interest Rate
5.83%
Mortgage Type
Purchase Money Mortgage
Estimated Equity
$325,468
Purchase Details
Closed on
Oct 7, 2002
Sold by
Tw Homes/Arizona Inc
Bought by
Rocha Eleacer
Home Financials for this Owner
Home Financials are based on the most recent Mortgage that was taken out on this home.
Original Mortgage
$104,112
Interest Rate
5.83%
Mortgage Type
Purchase Money Mortgage
Create a Home Valuation Report for This Property
The Home Valuation Report is an in-depth analysis detailing your home's value as well as a comparison with similar homes in the area
Home Values in the Area
Average Home Value in this Area
Purchase History
| Date | Buyer | Sale Price | Title Company |
|---|---|---|---|
| Rocha Eleacer | -- | -- | |
| Rocha Eleacer | -- | First American Title Ins Co | |
| Rocha Eleacer | $130,140 | First American Title Ins Co | |
| Tw Homes/Arizona Inc | -- | First American Title Ins Co |
Source: Public Records
Mortgage History
| Date | Status | Borrower | Loan Amount |
|---|---|---|---|
| Open | Rocha Eleacer | $104,112 | |
| Previous Owner | Tw Homes/Arizona Inc | $104,112 |
Source: Public Records
Tax History Compared to Growth
Tax History
| Year | Tax Paid | Tax Assessment Tax Assessment Total Assessment is a certain percentage of the fair market value that is determined by local assessors to be the total taxable value of land and additions on the property. | Land | Improvement |
|---|---|---|---|---|
| 2025 | $1,038 | $11,232 | -- | -- |
| 2024 | $1,023 | $10,697 | -- | -- |
| 2023 | $1,023 | $27,430 | $5,480 | $21,950 |
| 2022 | $1,027 | $20,450 | $4,090 | $16,360 |
| 2021 | $1,086 | $18,770 | $3,750 | $15,020 |
| 2020 | $1,090 | $16,960 | $3,390 | $13,570 |
| 2019 | $1,057 | $15,080 | $3,010 | $12,070 |
| 2018 | $1,045 | $13,810 | $2,760 | $11,050 |
| 2017 | $976 | $12,130 | $2,420 | $9,710 |
| 2016 | $942 | $11,430 | $2,280 | $9,150 |
| 2015 | $879 | $11,410 | $2,280 | $9,130 |
Source: Public Records
Map
Nearby Homes
- 12753 W Pershing St
- 12902 W Pershing St
- 12813 W Valentine Ave
- 13117 N 127th Ln
- 12924 W Ash St
- 12901 N 130th Dr
- 12909 W Aster Dr
- 12841 W Aster Dr
- 12621 W Aster Dr
- 12518 W Surrey Ave
- 13726 N 130th Ave
- 13021 W Windrose Dr
- 12834 W Corrine Dr
- 12505 W Surrey Ave
- 12623 W Rosewood Dr
- 12744 W Columbine Dr
- 12761 W Ventura St
- 12732 W Columbine Dr
- 12426 W Surrey Ave Unit 4
- 12709 W Ventura St
- 12805 W Pershing St
- 12813 W Pershing St
- 12801 W Pershing St
- 12817 W Pershing St
- 12810 W Myer Ln
- 12814 W Myer Ln
- 12806 W Myer Ln
- 12757 W Pershing St
- 12821 W Pershing St
- 12802 W Myer Ln
- 12818 W Myer Ln
- 12810 W Pershing St
- 12806 W Pershing St
- 12814 W Pershing St
- 12802 W Pershing St
- 12758 W Myer Ln
- 12822 W Myer Ln
- 12825 W Pershing St
- 12825 W Pershing St
- 12758 W Pershing St