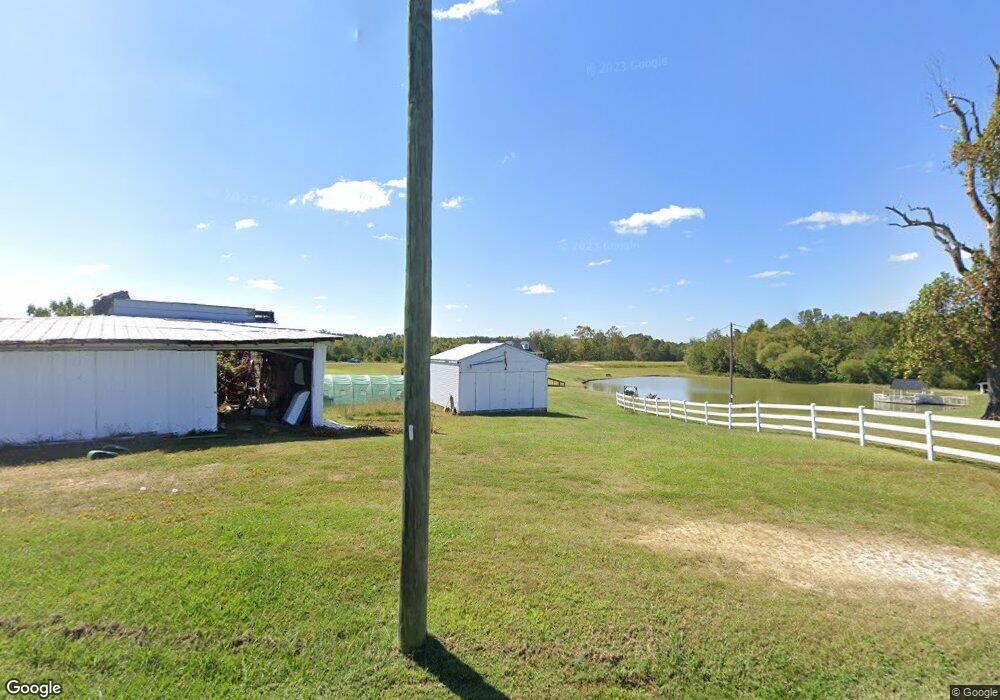
1281 Jeffries Cross Rd Burlington, NC 27217
Estimated Value: $253,000 - $432,000
3
Beds
2
Baths
1,560
Sq Ft
$234/Sq Ft
Est. Value
About This Home
This home is located at 1281 Jeffries Cross Rd, Burlington, NC 27217 and is currently estimated at $365,667, approximately $234 per square foot. 1281 Jeffries Cross Rd is a home with nearby schools including Pleasant Grove Elementary School, Woodlawn Middle School, and Eastern Alamance High School.
Ownership History
Date
Name
Owned For
Owner Type
Purchase Details
Closed on
Jan 17, 2023
Sold by
Holder Sherry L
Bought by
Cipperley Kyle Kenneth and Cipperley Rebecca Lynn
Current Estimated Value
Home Financials for this Owner
Home Financials are based on the most recent Mortgage that was taken out on this home.
Original Mortgage
$85,000
Outstanding Balance
$56,954
Interest Rate
6.33%
Mortgage Type
Seller Take Back
Estimated Equity
$308,713
Purchase Details
Closed on
Feb 25, 2020
Sold by
Crews Mary Elizabeth Coleman and Crews Kenneth R
Bought by
Holder Johnny T and Holder Sherry L
Home Financials for this Owner
Home Financials are based on the most recent Mortgage that was taken out on this home.
Original Mortgage
$225,000
Interest Rate
3.6%
Mortgage Type
New Conventional
Create a Home Valuation Report for This Property
The Home Valuation Report is an in-depth analysis detailing your home's value as well as a comparison with similar homes in the area
Home Values in the Area
Average Home Value in this Area
Purchase History
| Date | Buyer | Sale Price | Title Company |
|---|---|---|---|
| Cipperley Kyle Kenneth | $165,000 | -- | |
| Holder Johnny T | $375,000 | Attorney |
Source: Public Records
Mortgage History
| Date | Status | Borrower | Loan Amount |
|---|---|---|---|
| Open | Cipperley Kyle Kenneth | $85,000 | |
| Previous Owner | Holder Johnny T | $225,000 |
Source: Public Records
Tax History Compared to Growth
Tax History
| Year | Tax Paid | Tax Assessment Tax Assessment Total Assessment is a certain percentage of the fair market value that is determined by local assessors to be the total taxable value of land and additions on the property. | Land | Improvement |
|---|---|---|---|---|
| 2025 | $2,196 | $369,754 | $100,917 | $268,837 |
| 2024 | $2,041 | $369,754 | $100,917 | $268,837 |
| 2023 | $1,895 | $369,754 | $100,917 | $268,837 |
| 2022 | $3,128 | $408,320 | $242,858 | $165,462 |
| 2021 | $1,852 | $244,974 | $219,876 | $25,098 |
| 2020 | $1,877 | $244,974 | $219,876 | $25,098 |
| 2019 | $678 | $87,986 | $62,888 | $25,098 |
| 2018 | $0 | $87,986 | $62,888 | $25,098 |
| 2017 | $598 | $87,986 | $62,888 | $25,098 |
| 2016 | $784 | $115,344 | $91,540 | $23,804 |
| 2015 | $1,174 | $178,806 | $105,459 | $73,347 |
| 2014 | -- | $142,705 | $69,358 | $73,347 |
Source: Public Records
Map
Nearby Homes
- 000 Durham St
- 0000 Durham Street Extension
- 0 Nc Hwy 62 Unit LotWP001
- 625 Mccray Rd
- 3263 Fleming Graham Rd
- 3345 Fleming Graham Rd
- 3295 Fleming Graham Rd
- 1067 Mccray Rd
- 0 Willie Pace Rd
- 526 Bob Rainey Trail
- 2533 Holly Brook Dr
- 3655 N Carolina 62
- 30 Stoney Creek Church Rd
- 3615 N Carolina 62
- 2995 Faucette Ln
- 5080 Indian Camp Rd
- 302 Jordan Creek Dr
- 2837 Faucette Ln
- Lot 14 Crumpton Trail
- Lot 15 Crumpton Trail
- 1233 Jeffries Cross Rd
- 1236 Jeffries Cross Rd
- 1280 Jeffries Cross Rd
- 1344 Jeffries Cross Rd
- 0 Sawmill Drive Lot 7
- 0 Sawmill Drive Lot 9
- 0 Jeffries Cross Rd Unit 10014460
- 1 Jeffries Cross Rd
- Lot 4 Jeffries Cross Rd
- Lot 8 Jeffries Cross Rd
- Lot 6 Jeffries Cross Rd
- Lot 9 Jeffries Cross Rd
- Lot 10 Jeffries Cross Rd
- Lot 3 Jeffries Cross Rd
- Lot 1 Jeffries Cross Rd
- 0 Jeffries Cross Rd Unit 43099
- 0 Jeffries Cross Rd Unit 53865
- 0 Jeffries Cross Rd Unit 56161
- 0 Jeffries Cross Rd Unit 723378
- 0 Jeffries Cross Rd Unit 910162