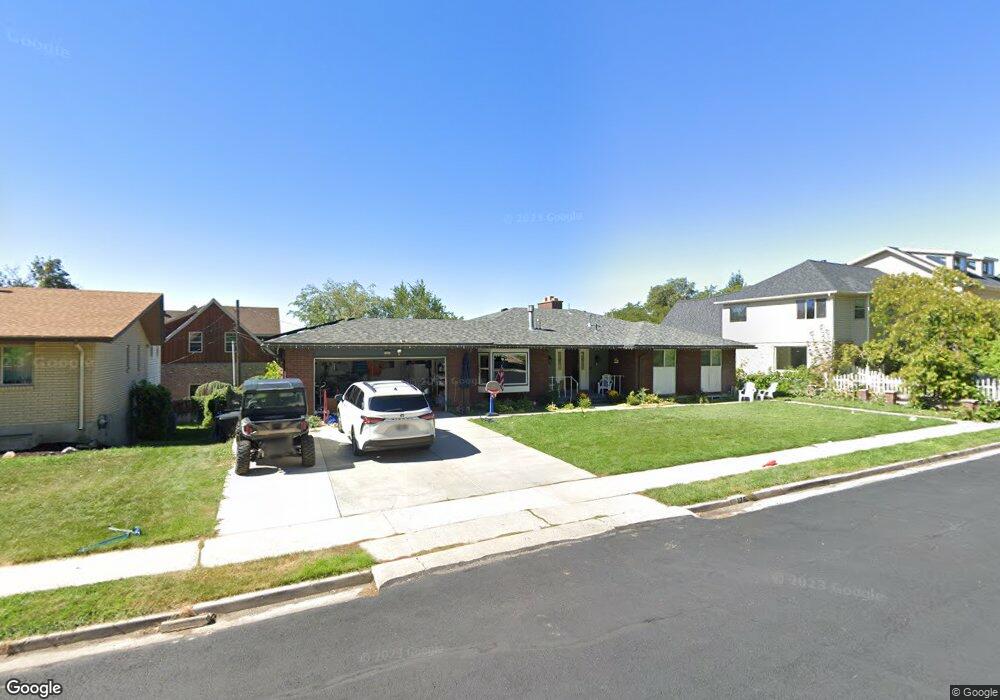
1281 Locust Ln Provo, UT 84604
Wasatch NeighborhoodEstimated Value: $677,000 - $762,595
4
Beds
4
Baths
2,030
Sq Ft
$351/Sq Ft
Est. Value
About This Home
This home is located at 1281 Locust Ln, Provo, UT 84604 and is currently estimated at $713,532, approximately $351 per square foot. 1281 Locust Ln is a home located in Utah County with nearby schools including Wasatch Elementary School, Centennial Middle School, and Timpview High School.
Ownership History
Date
Name
Owned For
Owner Type
Purchase Details
Closed on
Aug 10, 2020
Sold by
Cook Alonzo David and Cook Amy Miskin
Bought by
Thurston Michael D
Current Estimated Value
Home Financials for this Owner
Home Financials are based on the most recent Mortgage that was taken out on this home.
Original Mortgage
$475,000
Outstanding Balance
$418,371
Interest Rate
3.1%
Mortgage Type
New Conventional
Estimated Equity
$295,161
Purchase Details
Closed on
Mar 17, 2017
Sold by
Cook Alonzo David and Cook Amy Miskin
Bought by
Cook Alonzo David and Cook Amy Miskin
Purchase Details
Closed on
Feb 6, 2017
Sold by
Cook Alonzo David and Cook Amy Miskin
Bought by
Cook Alonzo David and Cook Amy Miskin
Purchase Details
Closed on
Mar 28, 2013
Sold by
Warner Allison H and Benn Patricia H
Bought by
Cook Alonzo David and Cook Amy Miskin
Home Financials for this Owner
Home Financials are based on the most recent Mortgage that was taken out on this home.
Original Mortgage
$244,000
Interest Rate
3.47%
Mortgage Type
New Conventional
Create a Home Valuation Report for This Property
The Home Valuation Report is an in-depth analysis detailing your home's value as well as a comparison with similar homes in the area
Home Values in the Area
Average Home Value in this Area
Purchase History
| Date | Buyer | Sale Price | Title Company |
|---|---|---|---|
| Thurston Michael D | -- | Utah First Title Insurance A | |
| Cook Alonzo David | -- | None Available | |
| Cook Alonzo David | -- | None Available | |
| Cook Alonzo David | -- | Affiliated First Title Co |
Source: Public Records
Mortgage History
| Date | Status | Borrower | Loan Amount |
|---|---|---|---|
| Open | Thurston Michael D | $475,000 | |
| Previous Owner | Cook Alonzo David | $244,000 |
Source: Public Records
Tax History
| Year | Tax Paid | Tax Assessment Tax Assessment Total Assessment is a certain percentage of the fair market value that is determined by local assessors to be the total taxable value of land and additions on the property. | Land | Improvement |
|---|---|---|---|---|
| 2025 | $3,567 | $388,190 | -- | -- |
| 2024 | $3,567 | $351,120 | $0 | $0 |
| 2023 | $3,390 | $329,010 | $0 | $0 |
| 2022 | $3,214 | $314,435 | $0 | $0 |
| 2021 | $2,618 | $446,800 | $186,100 | $260,700 |
| 2020 | $2,528 | $404,500 | $148,900 | $255,600 |
| 2019 | $2,364 | $393,300 | $148,900 | $244,400 |
| 2018 | $2,100 | $354,300 | $141,800 | $212,500 |
| 2017 | $2,017 | $187,055 | $0 | $0 |
| 2016 | $2,100 | $181,445 | $0 | $0 |
| 2015 | $1,920 | $167,695 | $0 | $0 |
| 2014 | $1,793 | $163,295 | $0 | $0 |
Source: Public Records
Map
Nearby Homes
- 1205 N Old Willow Ln
- 1040 N Oakmont Ln
- 1411 N Locust Ln
- 990 Cedar Ave
- 1215 N Terrace Dr
- 905 N Terrace Dr
- 907 E 820 N Unit 11
- 635 N Ridge Dr Unit 25
- 1866 N 1450 E
- 737 E 750 N Unit 1
- 735 E 620 N
- 785 E 560 N Unit 405
- 2025 Oak Ln
- 1383 E 320 N
- 1801 N 650 E
- 513 E 700 N
- 1051 E 300 N
- 362 N 800 E
- 541 E 500 N Unit 12
- 360 Sumac Ln
- 1291 Locust Ln
- 1291 N Locust Ln
- 1263 Locust Ln
- 1299 Aspen Ave
- 1276 Aspen Ave
- 1225 N Locust Ln
- 1225 Locust Ln
- 1303 Locust Ln
- 1271 Aspen Ave
- 1303 N Locust Ln
- 1278 N Locust Ln
- 1341 N Locust Ln
- 1280 Maple Ln
- 1256 Locust Ln
- 1243 Aspen Ave
- 1209 N Locust Ln
- 1307 Locust Ln
- 1307 N Locust Ln
- 1209 Locust Ln
- 1230 Locust Ln
Your Personal Tour Guide
Ask me questions while you tour the home.