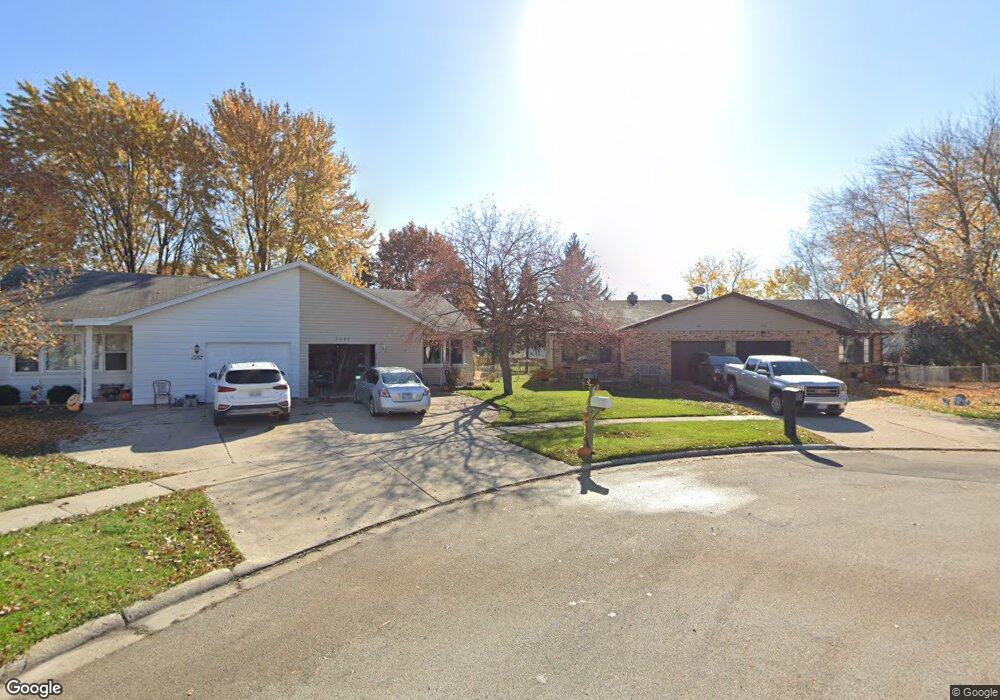
1281 Pappas Ct Elgin, IL 60123
Century Oaks West NeighborhoodEstimated Value: $216,000 - $252,000
2
Beds
1
Bath
874
Sq Ft
$263/Sq Ft
Est. Value
About This Home
This home is located at 1281 Pappas Ct, Elgin, IL 60123 and is currently estimated at $229,789, approximately $262 per square foot. 1281 Pappas Ct is a home located in Kane County with nearby schools including Century Oaks Elementary School, Kimball Middle School, and Larkin High School.
Ownership History
Date
Name
Owned For
Owner Type
Purchase Details
Closed on
Feb 19, 2021
Sold by
Dupage Elgin Llc
Bought by
Johnson Gina M
Current Estimated Value
Home Financials for this Owner
Home Financials are based on the most recent Mortgage that was taken out on this home.
Original Mortgage
$114,000
Outstanding Balance
$90,345
Interest Rate
2.37%
Mortgage Type
New Conventional
Estimated Equity
$139,444
Purchase Details
Closed on
Feb 5, 2016
Sold by
Morland Richard H and Morland Patricia A
Bought by
The Morland Tuition Trust and Morland Patricia A
Purchase Details
Closed on
Aug 28, 1998
Sold by
Kerrigan James T
Bought by
Oconnell Shirley A
Home Financials for this Owner
Home Financials are based on the most recent Mortgage that was taken out on this home.
Original Mortgage
$82,400
Interest Rate
7.06%
Purchase Details
Closed on
Oct 7, 1994
Sold by
Kerrigan Mary M
Bought by
Kerrigan James T and Mary M Kerrigan Trust #1
Create a Home Valuation Report for This Property
The Home Valuation Report is an in-depth analysis detailing your home's value as well as a comparison with similar homes in the area
Home Values in the Area
Average Home Value in this Area
Purchase History
We collect this data history from publicly available records. To have your information removed, we recommend requesting removal directly through your county’s website.
| Date | Buyer | Sale Price | Title Company |
|---|---|---|---|
| Johnson Gina M | $144,000 | Chicago Title | |
| The Morland Tuition Trust | -- | Attorney | |
| Oconnell Shirley A | $103,000 | -- | |
| Kerrigan James T | -- | -- |
Source: Public Records
Mortgage History
We collect this data history from publicly available records. To have your information removed, we recommend requesting removal directly through your county’s website.
| Date | Status | Borrower | Loan Amount |
|---|---|---|---|
| Open | Johnson Gina M | $114,000 | |
| Previous Owner | Oconnell Shirley A | $82,400 |
Source: Public Records
Tax History
| Year | Tax Paid | Tax Assessment Tax Assessment Total Assessment is a certain percentage of the fair market value that is determined by local assessors to be the total taxable value of land and additions on the property. | Land | Improvement |
|---|---|---|---|---|
| 2024 | $3,961 | $57,494 | $14,199 | $43,295 |
| 2023 | $3,746 | $51,942 | $12,828 | $39,114 |
| 2022 | $3,587 | $47,362 | $11,697 | $35,665 |
| 2021 | $3,951 | $44,280 | $10,936 | $33,344 |
| 2020 | $3,855 | $42,272 | $10,440 | $31,832 |
| 2019 | $3,761 | $40,267 | $9,945 | $30,322 |
| 2018 | $3,750 | $37,934 | $9,369 | $28,565 |
| 2017 | $3,688 | $35,861 | $8,857 | $27,004 |
| 2016 | $3,548 | $33,269 | $8,217 | $25,052 |
| 2015 | -- | $30,494 | $7,532 | $22,962 |
| 2014 | -- | $30,118 | $7,439 | $22,679 |
| 2013 | -- | $30,912 | $7,635 | $23,277 |
Source: Public Records
Map
Nearby Homes
- 1560 Sheffield Dr
- 88 Devonshire Cir Unit 1
- 1285 N Lyle Ave
- 25 Devonshire Cir
- 2176 Jordan Ln
- 801 N Mclean Blvd Unit 140
- 801 N Mclean Blvd Unit 206
- 801 N Mclean Blvd Unit 330
- 801 N Mclean Blvd Unit 320
- 801 N Mclean Blvd Unit 124
- 801 N Mclean Blvd Unit 136
- 801 N Mclean Blvd Unit 222
- 801 N Mclean Blvd Unit 156
- 801 N Mclean Blvd Unit 308
- 836 Millcreek Cir
- 637 N Lyle Ave
- 1406 Kaskaskia Ave
- 585 N Lyle Ave
- 530 Cumberland Trail
- 36W628 Oak Hill Dr
- 1285 Pappas Ct
- 1287 Pappas Ct Unit 3
- 1613 Sheffield Ct Unit 15
- 1283 Pappas Ct
- 1611 Sheffield Ct
- 1611 Sheffield Ct Unit 1611
- 1635 Sheffield Dr Unit 37
- 1635 Sheffield Dr
- 1637 Sheffield Dr
- 1621 Sheffield Dr
- 1284 Pappas Ct
- 1282 Pappas Ct Unit 84
- 1619 Sheffield Dr Unit 3
- 1609 Sheffield Ct
- 1286 Pappas Ct
- 1673 Sheffield Dr
- 1288 Pappas Ct
- 1603 Sheffield Ct
- 1605 Sheffield Ct
- 1675 Sheffield Dr
Your Personal Tour Guide
Ask me questions while you tour the home.