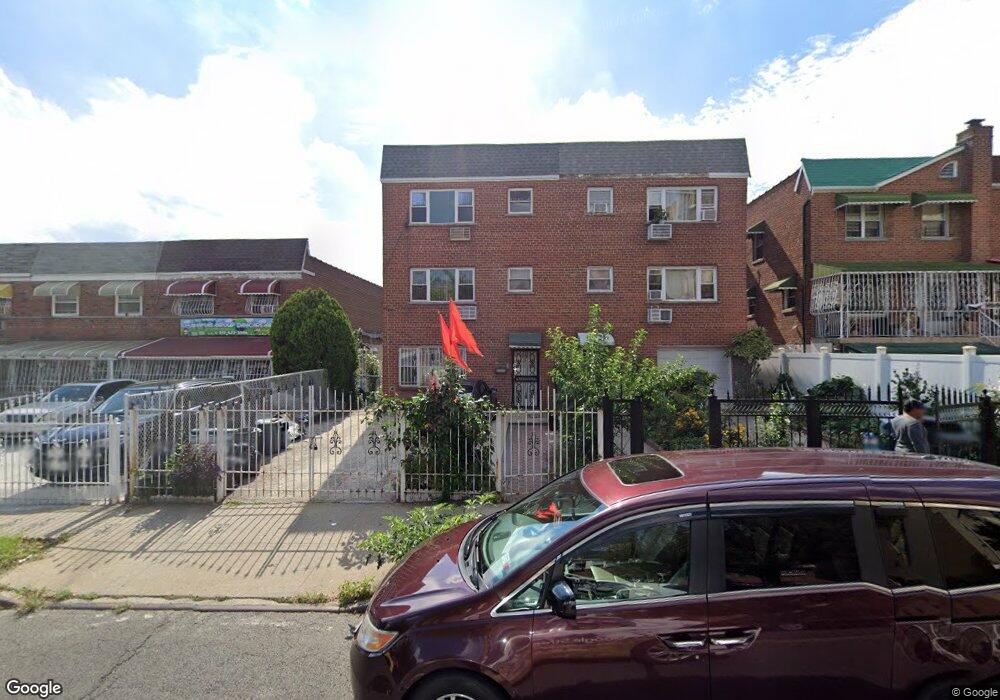
1281 Rosedale Ave Bronx, NY 10472
Parkchester NeighborhoodEstimated Value: $843,071 - $922,000
5
Beds
2
Baths
2,820
Sq Ft
$313/Sq Ft
Est. Value
About This Home
This home is located at 1281 Rosedale Ave, Bronx, NY 10472 and is currently estimated at $882,018, approximately $312 per square foot. 1281 Rosedale Ave is a home located in Bronx County with nearby schools including P.S. 214, P.S. 47 - John Randolph, and Holy Family School.
Ownership History
Date
Name
Owned For
Owner Type
Purchase Details
Closed on
Jan 23, 2024
Sold by
Jamwant Ravindranauth
Bought by
Autar Lennie and Persaud Subrina S
Current Estimated Value
Home Financials for this Owner
Home Financials are based on the most recent Mortgage that was taken out on this home.
Original Mortgage
$640,000
Outstanding Balance
$627,429
Interest Rate
6.61%
Mortgage Type
Purchase Money Mortgage
Estimated Equity
$254,589
Purchase Details
Closed on
Oct 4, 2017
Sold by
Cynthia Fletcher Mcquilkin As Trustee and Fletcher Barnes
Bought by
Jamwant Ravindranauth
Home Financials for this Owner
Home Financials are based on the most recent Mortgage that was taken out on this home.
Original Mortgage
$337,500
Interest Rate
3.85%
Mortgage Type
New Conventional
Purchase Details
Closed on
Jun 9, 2010
Sold by
Fletcher Myrtle
Bought by
Cynthia Fletcher Mcquilkin Trustee and The Myrtle B Fletcher Irrevocable Trust
Create a Home Valuation Report for This Property
The Home Valuation Report is an in-depth analysis detailing your home's value as well as a comparison with similar homes in the area
Home Values in the Area
Average Home Value in this Area
Purchase History
| Date | Buyer | Sale Price | Title Company |
|---|---|---|---|
| Autar Lennie | $800,000 | -- | |
| Autar Lennie | $800,000 | -- | |
| Jamwant Ravindranauth | $450,000 | -- | |
| Jamwant Ravindranauth | $450,000 | -- | |
| Cynthia Fletcher Mcquilkin Trustee | -- | -- | |
| Cynthia Fletcher Mcquilkin Trustee | -- | -- |
Source: Public Records
Mortgage History
| Date | Status | Borrower | Loan Amount |
|---|---|---|---|
| Open | Autar Lennie | $640,000 | |
| Closed | Autar Lennie | $640,000 | |
| Previous Owner | Jamwant Ravindranauth | $337,500 |
Source: Public Records
Tax History Compared to Growth
Tax History
| Year | Tax Paid | Tax Assessment Tax Assessment Total Assessment is a certain percentage of the fair market value that is determined by local assessors to be the total taxable value of land and additions on the property. | Land | Improvement |
|---|---|---|---|---|
| 2025 | $6,797 | $35,597 | $6,139 | $29,458 |
| 2024 | $6,797 | $33,840 | $6,952 | $26,888 |
| 2023 | $6,624 | $32,616 | $6,418 | $26,198 |
| 2022 | $6,277 | $43,920 | $9,540 | $34,380 |
| 2021 | $6,243 | $36,240 | $9,540 | $26,700 |
| 2020 | $6,279 | $40,020 | $9,540 | $30,480 |
| 2019 | $5,899 | $33,180 | $9,540 | $23,640 |
| 2018 | $5,541 | $27,180 | $9,540 | $17,640 |
| 2017 | $4,695 | $26,203 | $8,698 | $17,505 |
| 2016 | $4,321 | $24,720 | $9,540 | $15,180 |
| 2015 | $2,746 | $24,909 | $10,374 | $14,535 |
| 2014 | $2,746 | $23,500 | $9,042 | $14,458 |
Source: Public Records
Map
Nearby Homes
- 1270 Rosedale Ave
- 1248 Noble Ave
- 1254 Rosedale Ave
- 1274 Fteley Ave
- 1261 Fteley Ave
- 1317 Saint Lawrence Ave
- 1362 Noble Ave
- 1350 Croes Ave
- 1346 Fteley Ave
- 1661 E 172nd St
- 1448 & 1450 Rosedale Ave
- 1343 Saint Lawrence Ave
- 1242 Saint Lawrence Ave
- 1705 E 174th St
- 1636 E 172nd St
- 1347 Taylor Ave
- 1241 Taylor Ave
- 1156 Metcalf Ave
- 1210 Beach Ave
- 1151 Saint Lawrence Ave
- 1283 Rosedale Ave
- 1279 Rosedale Ave
- 1277 Rosedale Ave
- 1285 Rosedale Ave
- 1275 Rosedale Ave
- 1287 Rosedale Ave
- 1273 Rosedale Ave
- 1289 Rosedale Ave
- 1270 Noble Ave
- 1272 Noble Ave
- 1268 Noble Ave
- 1271 Rosedale Ave
- 1291 Rosedale Ave
- 1266 Noble Ave
- 1264 Noble Ave
- 1269 Rosedale Ave
- 1293 Rosedale Ave
- 1726 E 172nd St
- 1262 Noble Ave
- 1265 Rosedale Ave