Estimated Value: $142,000 - $150,440
3
Beds
1
Bath
1,150
Sq Ft
$127/Sq Ft
Est. Value
About This Home
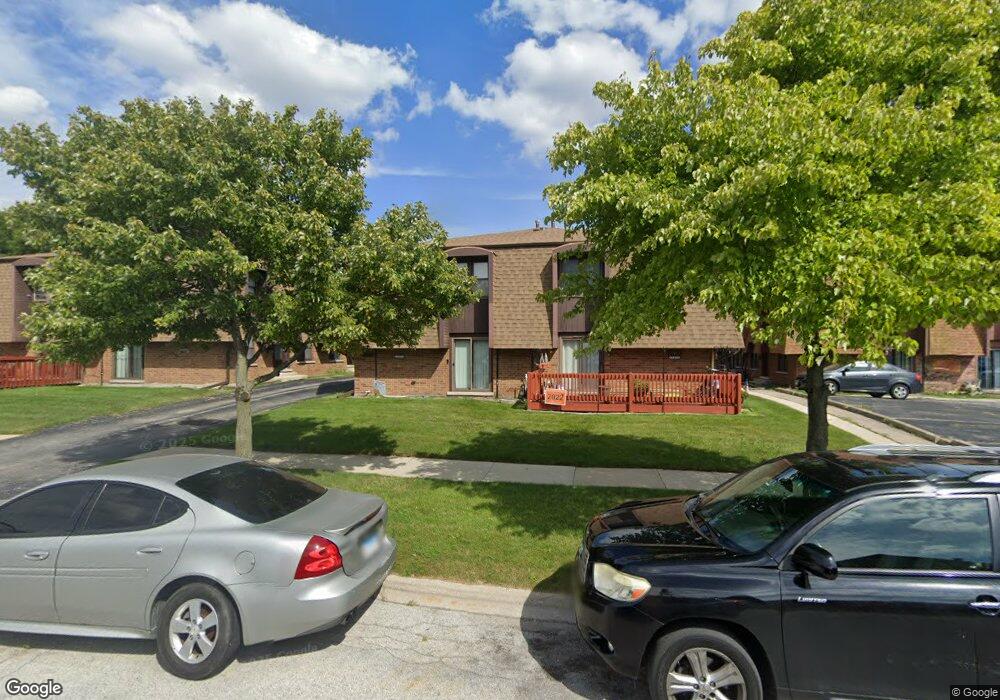
This home is located at 12813 S Kenneth Ave Unit E, Alsip, IL 60803 and is currently estimated at $145,610, approximately $126 per square foot. 12813 S Kenneth Ave Unit E is a home located in Cook County with nearby schools including George Washington Elementary School, Nathan Hale Middle School, and A B Shepard High School.
Ownership History
Date
Name
Owned For
Owner Type
Purchase Details
Closed on
Aug 12, 2025
Sold by
Christ Debra D and Garcia Debra D
Bought by
Grover Sarthak
Current Estimated Value
Home Financials for this Owner
Home Financials are based on the most recent Mortgage that was taken out on this home.
Original Mortgage
$140,000
Outstanding Balance
$139,879
Interest Rate
6.72%
Mortgage Type
New Conventional
Estimated Equity
$5,731
Purchase Details
Closed on
Oct 8, 2002
Sold by
Christ Debra D
Bought by
Christ Debra D and Garcia Steven
Home Financials for this Owner
Home Financials are based on the most recent Mortgage that was taken out on this home.
Original Mortgage
$89,000
Interest Rate
6.34%
Purchase Details
Closed on
Jun 30, 1995
Sold by
Pinnacle Bank
Bought by
Christ Debra D
Home Financials for this Owner
Home Financials are based on the most recent Mortgage that was taken out on this home.
Original Mortgage
$74,000
Interest Rate
7.9%
Purchase Details
Closed on
Nov 4, 1994
Sold by
Beikzadeh Ramezan
Bought by
Suburban Trust & Svgs Bank
Purchase Details
Closed on
Nov 3, 1994
Sold by
Sheahan Michael F
Bought by
Beikzadeh Ramezan
Create a Home Valuation Report for This Property
The Home Valuation Report is an in-depth analysis detailing your home's value as well as a comparison with similar homes in the area
Home Values in the Area
Average Home Value in this Area
Purchase History
| Date | Buyer | Sale Price | Title Company |
|---|---|---|---|
| Grover Sarthak | $140,000 | Fidelity National Title | |
| Christ Debra D | -- | -- | |
| Christ Debra D | $78,000 | -- | |
| Suburban Trust & Svgs Bank | -- | -- | |
| Beikzadeh Ramezan | $62,500 | -- |
Source: Public Records
Mortgage History
| Date | Status | Borrower | Loan Amount |
|---|---|---|---|
| Open | Grover Sarthak | $140,000 | |
| Previous Owner | Christ Debra D | $89,000 | |
| Previous Owner | Christ Debra D | $74,000 |
Source: Public Records
Tax History Compared to Growth
Tax History
| Year | Tax Paid | Tax Assessment Tax Assessment Total Assessment is a certain percentage of the fair market value that is determined by local assessors to be the total taxable value of land and additions on the property. | Land | Improvement |
|---|---|---|---|---|
| 2024 | $4,948 | $13,769 | $1,360 | $12,409 |
| 2023 | $3,589 | $13,769 | $1,360 | $12,409 |
| 2022 | $3,589 | $8,251 | $1,608 | $6,643 |
| 2021 | $3,414 | $8,249 | $1,607 | $6,642 |
| 2020 | $3,335 | $8,249 | $1,607 | $6,642 |
| 2019 | $3,345 | $8,028 | $1,484 | $6,544 |
| 2018 | $5,993 | $14,933 | $1,484 | $13,449 |
| 2017 | $5,050 | $15,719 | $1,484 | $14,235 |
| 2016 | $3,354 | $10,552 | $1,236 | $9,316 |
| 2015 | $2,931 | $10,552 | $1,236 | $9,316 |
| 2014 | $2,874 | $10,552 | $1,236 | $9,316 |
| 2013 | $3,040 | $10,999 | $1,236 | $9,763 |
Source: Public Records
Map
Nearby Homes
- 12824 S Kenneth Ave Unit F1
- 12738 S Kenneth Ave Unit E
- 12736 S Kenneth Ave Unit 1A
- 4406 W 127th Place
- 4343 W Emerald Way St
- 4326 W Emerald Way St
- 4336 W Emerald Way St
- 4654 W 131st St Unit 1S
- 12507 S Tripp Ave
- 14350 S Pulaski Rd
- 3729 W Glen Dr Unit 804
- 3909 W 123rd St Unit 205A
- 4735 W 122nd St
- 12539 S Quinn Dr Unit 402
- 3823 W 123rd St Unit 302
- 3821 W 123rd St Unit 301
- 12147 S Cicero Ave
- 12026 S Kildare Ave Unit 16
- 12211 S Harding Ave
- 4818 W 122nd St Unit 3W
- 12813 S Kenneth Ave Unit F
- 12813 S Kenneth Ave Unit G
- 12813 S Kenneth Ave Unit H
- 12805 S Kenneth Ave Unit C
- 12805 S Kenneth Ave Unit B
- 12805 S Kenneth Ave Unit A
- 12805 S Kenneth Ave Unit D
- 12805 S Kenneth Ave
- 12815 S Kenneth Ave Unit C
- 12815 S Kenneth Ave Unit D
- 12815 S Kenneth Ave Unit B
- 12815 S Kenneth Ave Unit A
- 12815 S Kenneth Ave Unit 7D
- 12819 S Kenneth Ave Unit A1
- 12819 S Kenneth Ave Unit A4
- 12819 S Kenneth Ave Unit A2
- 12819 S Kenneth Ave Unit A3
- 12819 S Kenneth Ave Unit A5
- 12819 S Kenneth Ave Unit A6
- 12762 S Kenneth Ave Unit G