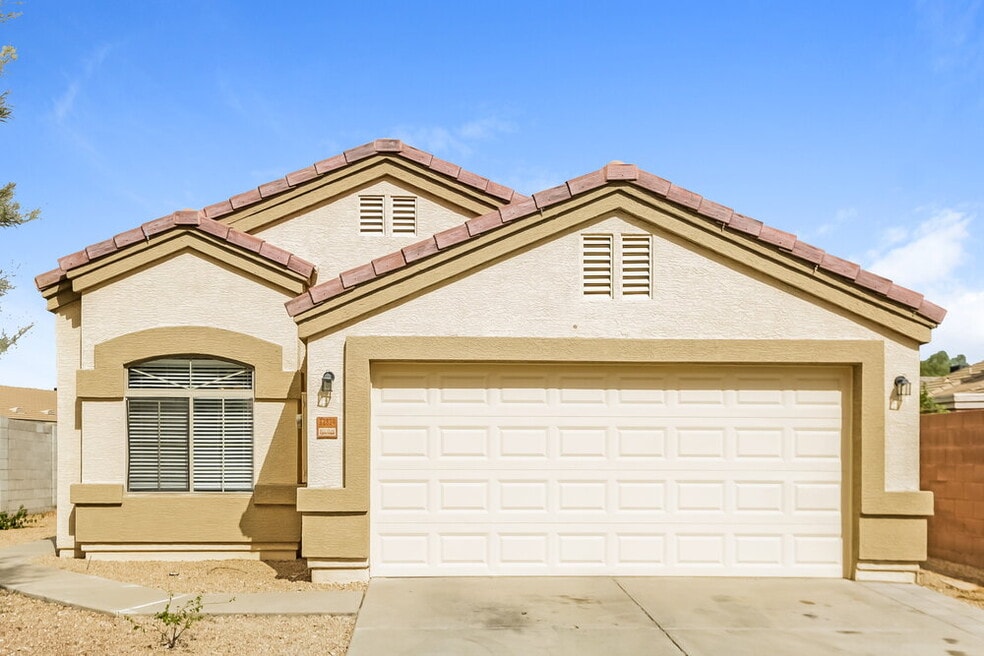
12814 W Crocus Dr El Mirage, AZ 85335
About This Home
Please note, our homes are available on a first-come, first-serve basis and are not reserved until the holding fee agreement is signed and the holding fee is paid by the primary applicant.
This home features Progress Smart Home - Progress Residential's smart home app, which allows you to control the home securely from any of your devices. Learn more at
Coming soon! This home is currently being enjoyed by another resident but will be available soon. Please respect their privacy and do not disturb. You can complete the application process and reserve this home for a $500 non-refundable holding fee until it's ready for move-in. This fee must be paid within 24 hours of being pre-qualified and will be applied to your first month’s rent if you enter into a lease for this home.
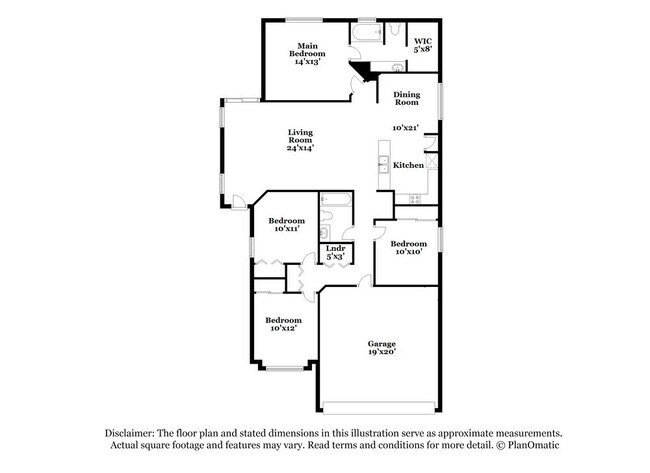
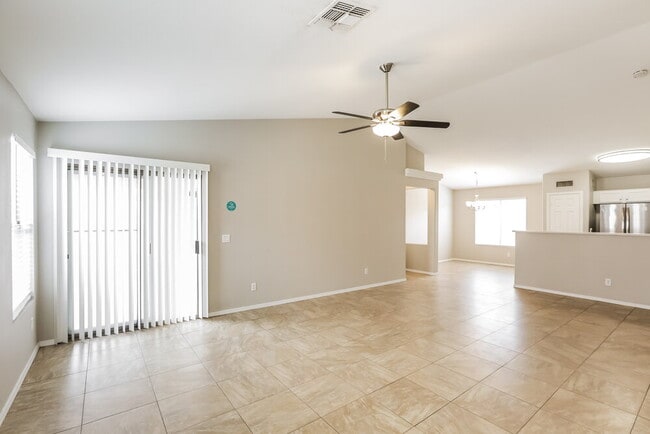
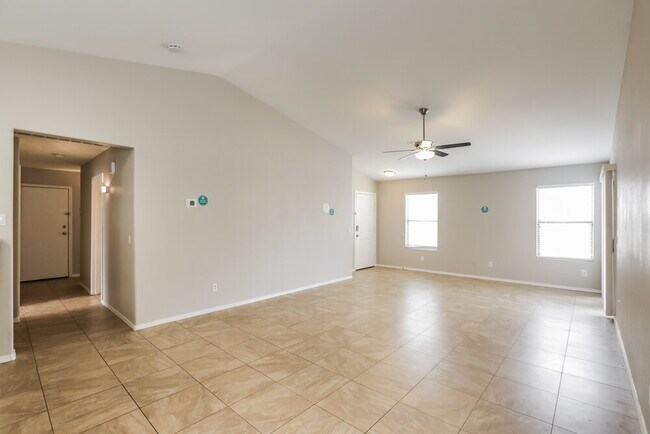
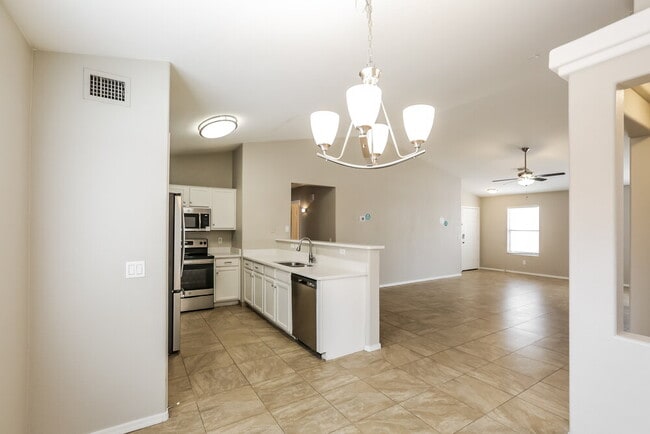
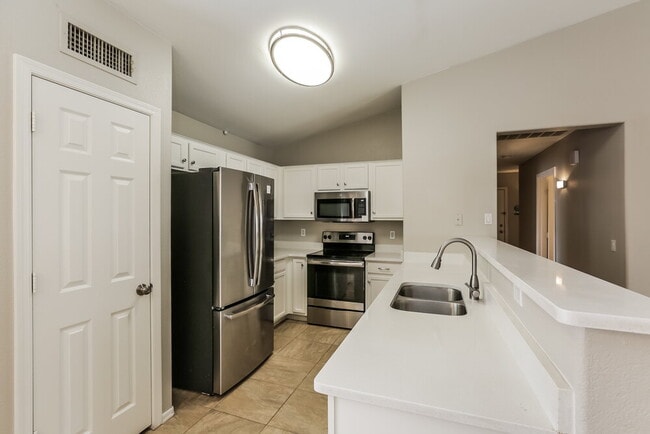
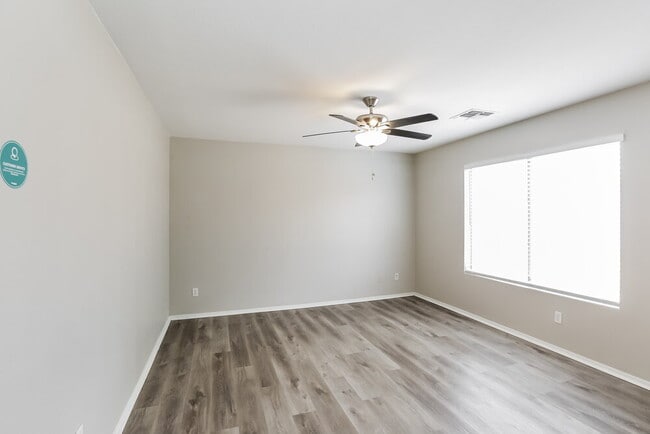
Interested in this home? You clearly have exceptional taste. This charming 4-bedroom, 2-bathroom home is not only pet-friendly, but also equipped with smart home features to make everyday life more convenient and connected. Homes like this don’t stay on the market for long—don’t miss your chance to make it yours. Apply today!

Map
- 12814 W Hearn Rd
- 14506 N 129th Ave
- 12706 W Redfield Rd
- 12905 W Crocus Dr
- 12838 W Via Camille
- 13033 W Evans Dr
- 12571 W Mauna Loa Ln
- 12510 W Santa fe Ln
- 12761 W Ventura St
- 13037 W Lisbon Ln
- 12709 W Ventura St
- 14505 N 125th Ave
- 14248 N Gil Balcome
- 12475 W Mandalay Ln
- 14626 N 132nd Ave
- 13106 W Calavar Rd
- 13165 W Ventura St
- 12462 W Via Camille
- 13726 N 130th Ave
- 12721 W Greenway Rd Unit 200
- 12817 W Redfield Rd
- 14214 N 129th Ave
- 12734 W Via Camille
- 13009 W Evans Dr
- 13007 W Mandalay Ln
- 12917 W Redfield Rd
- 14821 N 129th Dr
- 12813 W Mauna Loa Ln
- 13008 W Lisbon Ln
- 12567 W Mauna Loa Ln
- 12510 W Mandalay Ln
- 14916 N 125th Ln
- 13009 W Port Royale Ln
- 13043 W Via Camille
- 14313 N 125th Dr
- 12737 W Boca Raton Rd
- 14415 N 132nd Dr
- 12724 W Voltaire Ave
- 12807 W Voltaire Ave
- 14017 N 4th Ave