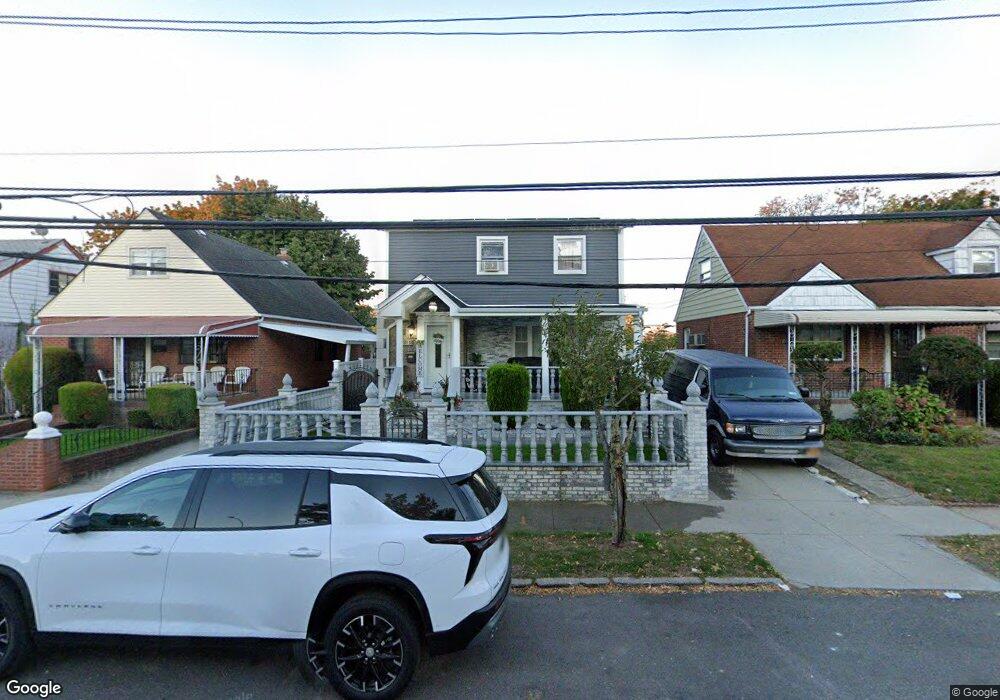
12818 Francis Lewis Blvd Springfield Gardens, NY 11413
Laurelton NeighborhoodEstimated Value: $781,071 - $827,000
2
Beds
1
Bath
1,750
Sq Ft
$463/Sq Ft
Est. Value
About This Home
This home is located at 12818 Francis Lewis Blvd, Springfield Gardens, NY 11413 and is currently estimated at $811,018, approximately $463 per square foot. 12818 Francis Lewis Blvd is a home located in Queens County with nearby schools including P.S. 176 Cambria Heights, Is 59 Springfield Gardens, and Cambria Center For The Gifted Child.
Ownership History
Date
Name
Owned For
Owner Type
Purchase Details
Closed on
Oct 24, 2018
Sold by
Neveim Llc
Bought by
Brandford Kadine L
Current Estimated Value
Home Financials for this Owner
Home Financials are based on the most recent Mortgage that was taken out on this home.
Original Mortgage
$623,498
Outstanding Balance
$543,777
Interest Rate
4.6%
Mortgage Type
New Conventional
Estimated Equity
$267,241
Purchase Details
Closed on
May 2, 2018
Sold by
Chapman Cassilda
Bought by
Neveim Llc
Purchase Details
Closed on
Sep 24, 2004
Sold by
Chapman Cassilda
Bought by
Chapman Cassilda and Kirkpatrick Leon
Purchase Details
Closed on
Nov 16, 2000
Sold by
Chapman Charles and Chapman Cassilda
Bought by
Chapman Cassilda
Home Financials for this Owner
Home Financials are based on the most recent Mortgage that was taken out on this home.
Original Mortgage
$61,730
Interest Rate
6.61%
Mortgage Type
Purchase Money Mortgage
Create a Home Valuation Report for This Property
The Home Valuation Report is an in-depth analysis detailing your home's value as well as a comparison with similar homes in the area
Home Values in the Area
Average Home Value in this Area
Purchase History
| Date | Buyer | Sale Price | Title Company |
|---|---|---|---|
| Brandford Kadine L | $635,000 | -- | |
| Brandford Kadine L | $635,000 | -- | |
| Neveim Llc | $320,000 | -- | |
| Neveim Llc | $320,000 | -- | |
| Neveim Llc | $320,000 | -- | |
| Chapman Cassilda | -- | -- | |
| Chapman Cassilda | -- | -- | |
| Chapman Cassilda | -- | -- | |
| Chapman Cassilda | -- | -- |
Source: Public Records
Mortgage History
| Date | Status | Borrower | Loan Amount |
|---|---|---|---|
| Open | Brandford Kadine L | $623,498 | |
| Closed | Brandford Kadine L | $623,498 | |
| Previous Owner | Chapman Cassilda | $61,730 | |
| Closed | Chapman Cassilda | $0 |
Source: Public Records
Tax History Compared to Growth
Tax History
| Year | Tax Paid | Tax Assessment Tax Assessment Total Assessment is a certain percentage of the fair market value that is determined by local assessors to be the total taxable value of land and additions on the property. | Land | Improvement |
|---|---|---|---|---|
| 2025 | $6,803 | $35,900 | $10,617 | $25,283 |
| 2024 | $5,839 | $33,869 | $10,314 | $23,555 |
| 2023 | $6,791 | $33,809 | $9,666 | $24,143 |
| 2022 | $5,404 | $39,840 | $12,900 | $26,940 |
| 2021 | $6,546 | $35,580 | $12,900 | $22,680 |
| 2020 | $6,333 | $33,120 | $12,900 | $20,220 |
| 2019 | $5,904 | $31,020 | $12,900 | $18,120 |
| 2018 | $5,743 | $28,174 | $11,280 | $16,894 |
| 2017 | $5,418 | $26,580 | $12,900 | $13,680 |
| 2016 | $5,182 | $26,580 | $12,900 | $13,680 |
| 2015 | $3,039 | $24,931 | $14,255 | $10,676 |
| 2014 | $3,039 | $23,520 | $14,340 | $9,180 |
Source: Public Records
Map
Nearby Homes
- 231-15 128th Rd
- 23107 126th Ave
- 129-08 Francis Lewis Blvd
- 12908 Francis Lewis Blvd
- 12831 233rd St
- 12819 234th St
- 130-20 232nd St
- 13001 228th St
- 130-16 233rd St
- 120-41 231st St
- 120-42 231st St
- 12810 236th St
- 120-47 228th St
- 234-16 130th Ave
- 120-51 234th St
- 0 235th St
- 120-43 234th St
- 12031 234th St
- 233-6 131st Ave Unit 1
- 130-07 225th St
- 128-18 Francis Lewis Blvd
- 128-18 Francis Lewis Blvd Unit HOUSE
- 128-18 N Francis Lewis Bl
- 12822 Francis Lewis Blvd
- 12814 Francis Lewis Blvd
- 12826 Francis Lewis Blvd
- 12810 Francis Lewis Blvd
- 12830 Francis Lewis Blvd
- 12806 Francis Lewis Blvd
- 12834 Francis Lewis Blvd
- 12802 Francis Lewis Blvd
- 23103 128th Rd
- 128-34 Francis Lewis Blvd
- 231-08 128th Ave
- 23104 128th Ave
- 12838 Francis Lewis Blvd
- 12622 Francis Lewis Blvd
- 23107 128th Rd
- 23104 128th Rd
- 23108 128th Ave