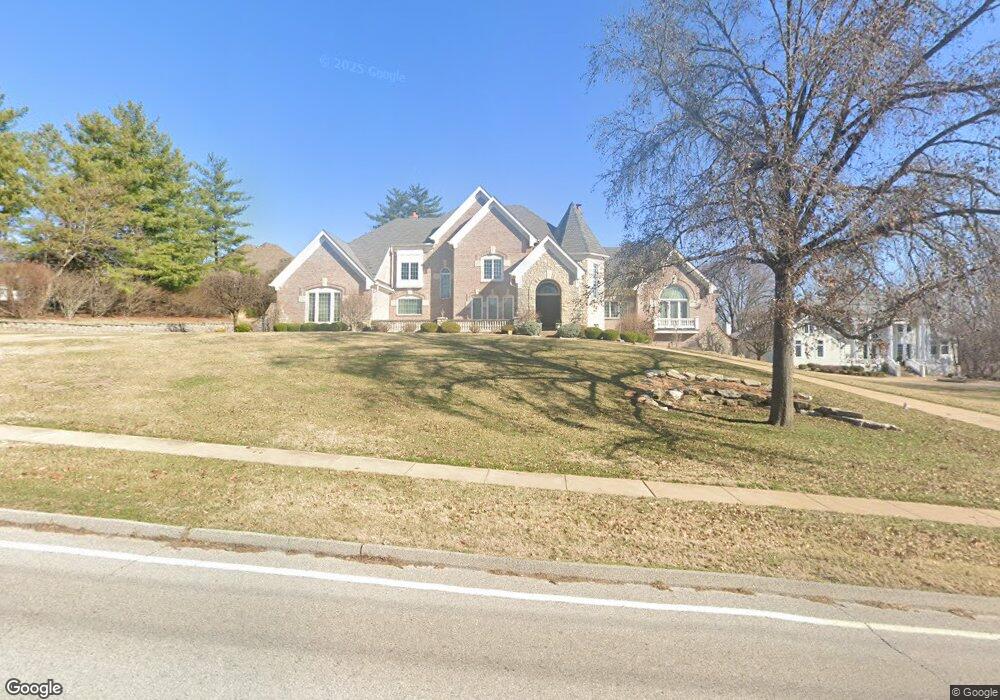
12819 Conway Rd Saint Louis, MO 63141
Estimated Value: $1,515,000 - $2,140,980
6
Beds
8
Baths
5,875
Sq Ft
$312/Sq Ft
Est. Value
About This Home
This home is located at 12819 Conway Rd, Saint Louis, MO 63141 and is currently estimated at $1,831,495, approximately $311 per square foot. 12819 Conway Rd is a home located in St. Louis County with nearby schools including Mason Ridge Elementary School, Parkway Central Middle School, and Parkway Central High School.
Ownership History
Date
Name
Owned For
Owner Type
Purchase Details
Closed on
Oct 14, 2014
Sold by
Haseeb Samrina
Bought by
Haseeb Mohammed and Haseeb Samrina
Current Estimated Value
Purchase Details
Closed on
Sep 20, 2004
Sold by
Haseeb Samrina and Haseeb Mohammed
Bought by
Haseeb Samrina and Samrina Haseeb Revocable Living Trust
Purchase Details
Closed on
Apr 7, 2004
Sold by
Sinn Construction
Bought by
Haseeb Samrina and Hasseeb Mohammed
Home Financials for this Owner
Home Financials are based on the most recent Mortgage that was taken out on this home.
Original Mortgage
$1,350,000
Interest Rate
5.61%
Mortgage Type
Purchase Money Mortgage
Purchase Details
Closed on
Nov 2, 2002
Sold by
Sinn Frank J and Sinn Patricia L
Bought by
Sinn Construction
Home Financials for this Owner
Home Financials are based on the most recent Mortgage that was taken out on this home.
Original Mortgage
$452,780
Interest Rate
6%
Create a Home Valuation Report for This Property
The Home Valuation Report is an in-depth analysis detailing your home's value as well as a comparison with similar homes in the area
Home Values in the Area
Average Home Value in this Area
Purchase History
| Date | Buyer | Sale Price | Title Company |
|---|---|---|---|
| Haseeb Mohammed | -- | None Available | |
| Haseeb Samrina | -- | -- | |
| Haseeb Samrina | $1,851,800 | -- | |
| Sinn Construction | $450,000 | -- |
Source: Public Records
Mortgage History
| Date | Status | Borrower | Loan Amount |
|---|---|---|---|
| Previous Owner | Haseeb Samrina | $1,350,000 | |
| Previous Owner | Sinn Construction | $452,780 |
Source: Public Records
Tax History Compared to Growth
Tax History
| Year | Tax Paid | Tax Assessment Tax Assessment Total Assessment is a certain percentage of the fair market value that is determined by local assessors to be the total taxable value of land and additions on the property. | Land | Improvement |
|---|---|---|---|---|
| 2025 | $21,825 | $352,130 | $68,400 | $283,730 |
| 2024 | $21,825 | $327,900 | $59,850 | $268,050 |
| 2023 | $21,546 | $327,900 | $59,850 | $268,050 |
| 2022 | $19,321 | $268,390 | $59,850 | $208,540 |
| 2021 | $19,148 | $268,390 | $59,850 | $208,540 |
| 2020 | $16,785 | $224,370 | $49,250 | $175,120 |
| 2019 | $16,524 | $224,370 | $49,250 | $175,120 |
| 2018 | $18,385 | $230,660 | $44,460 | $186,200 |
| 2017 | $18,207 | $230,660 | $44,460 | $186,200 |
| 2016 | $20,987 | $255,570 | $34,200 | $221,370 |
| 2015 | $21,889 | $255,570 | $34,200 | $221,370 |
| 2014 | $19,546 | $243,880 | $15,560 | $228,320 |
Source: Public Records
Map
Nearby Homes
- 12875 Conway Rd
- 353 Conway Gardens Ct
- 8 Chasselle Ln
- 13002 Bramblewood Acres Ln
- 10 Ridgecreek Rd
- 350 S Mason Rd
- 327 Chasselle Ln
- 390 Pebble Valley Dr
- 13250 Pinetree Lake Dr
- 12204 Ladue Rd
- 13256 Pebble Ridge Dr
- 415 Killearn Ln
- 12311 Gaillard Dr
- 8 Balcon Estates
- 15008 Spur Creek Rd
- 13321 Tree Top View Ct
- 485 Meadow Green Place
- 12331 Woodline Dr
- 12388 Country Glen Ln
- 12549 Bickford Dr
- 12811 Conway Rd
- 360 Laduemont Dr
- 372 Laduemont Dr
- 352 Laduemont Dr
- 424 Sheffield Estate Dr
- 430 Sheffield Estate Dr
- 405 Twin Creek Rd
- 406 Sheffield Estate Dr
- 365 Laduemont Dr
- 344 Laduemont Dr
- 373 Laduemont Dr
- 357 Laduemont Dr
- 417 Twin Creek Rd
- 408 Twin Creek Rd
- 12766 Conway Lake Ct
- 403 Sheffield Estate Dr
- 12760 Conway Lake Ct
- 332 Laduemont Dr
- 436 Sheffield Estate Dr
- 345 Laduemont Dr