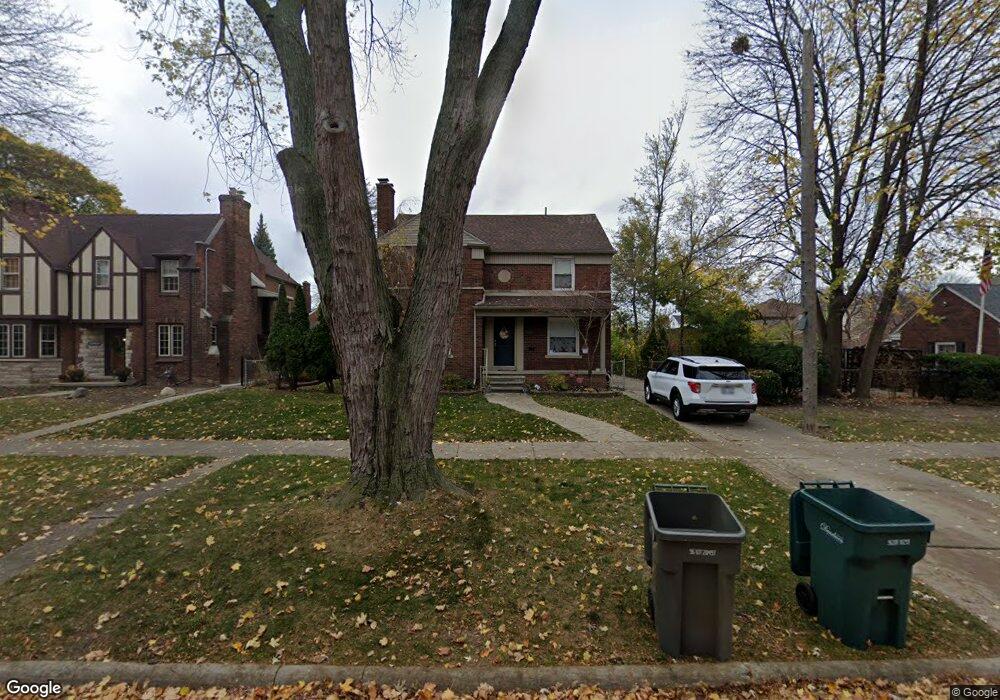
12819 S Morrow Cir Unit Bldg-Unit Dearborn, MI 48126
Aviation NeighborhoodEstimated Value: $363,197 - $523,000
4
Beds
3
Baths
1,942
Sq Ft
$210/Sq Ft
Est. Value
About This Home
This home is located at 12819 S Morrow Cir Unit Bldg-Unit, Dearborn, MI 48126 and is currently estimated at $408,549, approximately $210 per square foot. 12819 S Morrow Cir Unit Bldg-Unit is a home located in Wayne County with nearby schools including McCollough-Unis School, Fordson High School, and Riverside Academy East.
Ownership History
Date
Name
Owned For
Owner Type
Purchase Details
Closed on
Oct 23, 2018
Sold by
Abunab Nale
Bought by
Chami Mouwafak
Current Estimated Value
Purchase Details
Closed on
Jun 25, 2018
Sold by
Alnouri Mohamad and Nouri Mohamad
Bought by
Alunab Noel
Purchase Details
Closed on
Nov 2, 2015
Sold by
Elsharnoby Mohamed
Bought by
Alnouri Mohamed
Purchase Details
Closed on
Aug 1, 2011
Sold by
Nouri Imad and Nouri Carolyn Ann
Bought by
Elsharnoby Mohamed A
Purchase Details
Closed on
Mar 2, 2011
Sold by
Nouri Imad
Bought by
Federal Home Loan Mortgage Corp
Purchase Details
Closed on
Jun 3, 2008
Sold by
Nouri Imad
Bought by
Nouri Imad
Purchase Details
Closed on
Mar 5, 2008
Sold by
Alnouri Mohamed
Bought by
Nouri Imad
Purchase Details
Closed on
Dec 12, 2004
Sold by
Nouri Imad
Bought by
Nouri Mohamad Al
Purchase Details
Closed on
Sep 27, 2004
Sold by
Alnouri Mohamad S
Bought by
Nouri Imad
Create a Home Valuation Report for This Property
The Home Valuation Report is an in-depth analysis detailing your home's value as well as a comparison with similar homes in the area
Home Values in the Area
Average Home Value in this Area
Purchase History
| Date | Buyer | Sale Price | Title Company |
|---|---|---|---|
| Chami Mouwafak | $240,000 | Venture Title Agency | |
| Alunab Noel | $270,000 | Venture Title Agency | |
| Alnouri Mohamed | $10,000 | None Available | |
| Elsharnoby Mohamed A | $44,000 | None Available | |
| Federal Home Loan Mortgage Corp | $204,804 | None Available | |
| Nouri Imad | -- | Complete Title Services | |
| Nouri Imad | -- | None Available | |
| Nouri Mohamad Al | -- | None Available | |
| Nouri Imad | $195,000 | Multiple |
Source: Public Records
Tax History Compared to Growth
Tax History
| Year | Tax Paid | Tax Assessment Tax Assessment Total Assessment is a certain percentage of the fair market value that is determined by local assessors to be the total taxable value of land and additions on the property. | Land | Improvement |
|---|---|---|---|---|
| 2025 | $5,611 | $166,100 | $0 | $0 |
| 2024 | $5,611 | $165,500 | $0 | $0 |
| 2023 | $5,310 | $153,700 | $0 | $0 |
| 2022 | $5,975 | $133,200 | $0 | $0 |
| 2021 | $6,944 | $124,300 | $0 | $0 |
| 2019 | $6,873 | $108,900 | $0 | $0 |
| 2018 | $4,503 | $96,600 | $0 | $0 |
| 2017 | $1,292 | $86,800 | $0 | $0 |
| 2011 | -- | $70,500 | $0 | $0 |
Source: Public Records
Map
Nearby Homes
- 7361 Pinehurst St
- 7261 Reuter St
- 7658 Appoline St
- 7857 Esper Blvd
- 7741 Miller Rd
- 7653 Pinehurst St
- 7312 Theisen St
- 7634 Pinehurst St
- 6840 Oakman Blvd
- 7870 Oakman Blvd
- 7514 Calhoun St
- 6852 Jonathon St
- 12953 Tireman Ave
- 7750 Morross Ct
- 7927 Bingham St
- 7542 Neckel St
- 6855 Calhoun St
- 7900 Middlepointe St
- 7329 Neckel St
- 7656 Neckel St
- 12819 S Morrow Cir
- 12807 S Morrow Cir
- 7337 Appoline St
- 7350 Oakman Blvd
- 7342 Oakman Blvd
- 7327 Appoline St Unit Bldg-Unit
- 7327 Appoline St
- 7326 Oakman Blvd
- 7319 Appoline St
- 12743 S Morrow Cir
- 7318 Oakman Blvd
- 7311 Appoline St
- 7400 Oakman Blvd
- 12820 S Morrow Cir
- 7334 Appoline St
- 12733 S Morrow Cir
- 7328 Appoline St
- 7305 Appoline St
- 7310 Oakman Blvd
- 7320 Appoline St