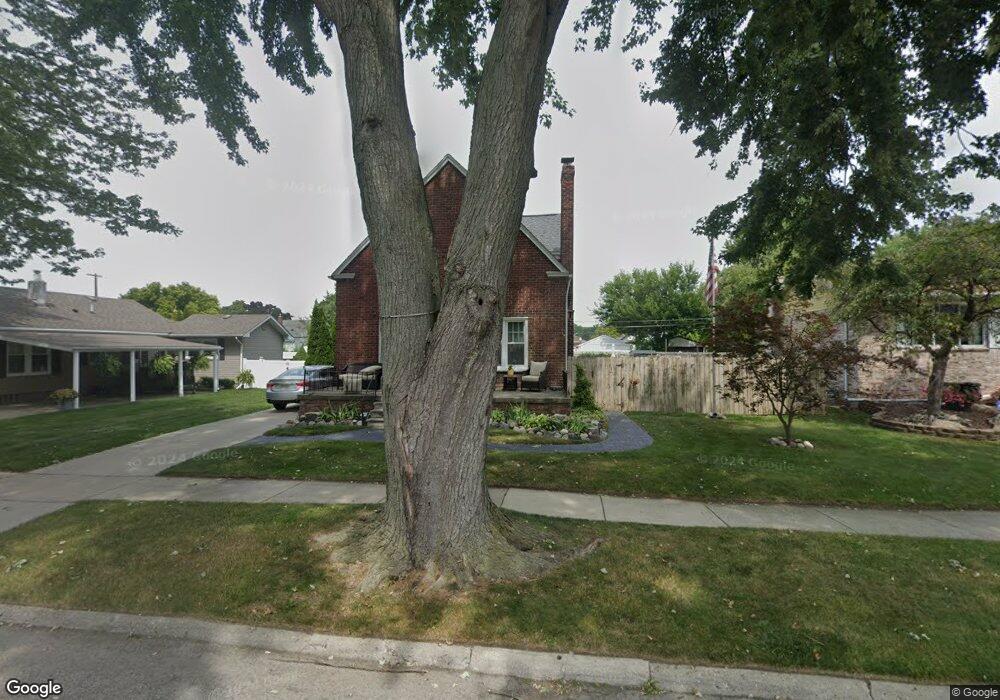
1282 Cedar St Wyandotte, MI 48192
Estimated Value: $255,326 - $376,000
--
Bed
--
Bath
2,203
Sq Ft
$147/Sq Ft
Est. Value
About This Home
This home is located at 1282 Cedar St, Wyandotte, MI 48192 and is currently estimated at $324,832, approximately $147 per square foot. 1282 Cedar St is a home located in Wayne County with nearby schools including Washington Elementary School, Woodrow Wilson School, and Roosevelt High School.
Ownership History
Date
Name
Owned For
Owner Type
Purchase Details
Closed on
Jan 21, 2021
Sold by
Ford Melissa and Ford Kyle
Bought by
Ford Melissa and Ford Kyle
Current Estimated Value
Purchase Details
Closed on
Aug 25, 2009
Sold by
Donovan Shaun
Bought by
Ford Kyle
Purchase Details
Closed on
Oct 28, 2008
Sold by
Phh Mortgage Corporation
Bought by
The Secretary Of Housing & Urban Develop
Purchase Details
Closed on
Sep 24, 2008
Sold by
Omeara Thomas J and Omeara Deena M
Bought by
Phh Mortgage Corp and Phh Mortgage Services Corp
Create a Home Valuation Report for This Property
The Home Valuation Report is an in-depth analysis detailing your home's value as well as a comparison with similar homes in the area
Home Values in the Area
Average Home Value in this Area
Purchase History
| Date | Buyer | Sale Price | Title Company |
|---|---|---|---|
| Ford Melissa | -- | None Available | |
| Ford Kyle | $42,001 | None Available | |
| The Secretary Of Housing & Urban Develop | -- | None Available | |
| Phh Mortgage Corp | $114,720 | None Available |
Source: Public Records
Tax History Compared to Growth
Tax History
| Year | Tax Paid | Tax Assessment Tax Assessment Total Assessment is a certain percentage of the fair market value that is determined by local assessors to be the total taxable value of land and additions on the property. | Land | Improvement |
|---|---|---|---|---|
| 2025 | $2,794 | $137,400 | $0 | $0 |
| 2024 | $2,794 | $134,200 | $0 | $0 |
| 2023 | $2,665 | $124,200 | $0 | $0 |
| 2022 | $3,087 | $112,100 | $0 | $0 |
| 2021 | $3,025 | $103,200 | $0 | $0 |
| 2020 | $2,983 | $92,900 | $0 | $0 |
| 2019 | $2,942 | $80,700 | $0 | $0 |
| 2018 | $2,348 | $62,400 | $0 | $0 |
| 2017 | $1,029 | $62,400 | $0 | $0 |
| 2016 | $2,888 | $57,800 | $0 | $0 |
| 2015 | $5,068 | $53,700 | $0 | $0 |
| 2013 | $4,910 | $49,100 | $0 | $0 |
| 2012 | $2,283 | $51,400 | $11,500 | $39,900 |
Source: Public Records
Map
Nearby Homes