1282 Fenwick Garth Arnold, MD 21012
Estimated Value: $1,742,000 - $3,061,000
Studio
3
Baths
2,462
Sq Ft
$997/Sq Ft
Est. Value
About This Home
This home is located at 1282 Fenwick Garth, Arnold, MD 21012 and is currently estimated at $2,453,979, approximately $996 per square foot. 1282 Fenwick Garth is a home located in Anne Arundel County with nearby schools including Jones Elementary School, Severna Park Middle School, and Severna Park High School.
Ownership History
Date
Name
Owned For
Owner Type
Purchase Details
Closed on
Oct 29, 2024
Sold by
Elling Robert K and Elling Kim B
Bought by
Robert K Elling Trust and Kim B Elling Trust
Current Estimated Value
Purchase Details
Closed on
Jan 18, 2017
Bought by
Elling Kim
Home Financials for this Owner
Home Financials are based on the most recent Mortgage that was taken out on this home.
Original Mortgage
$348,154
Interest Rate
4.12%
Purchase Details
Closed on
Jun 4, 1993
Sold by
Callari Giulio
Bought by
Elling Robert K and Elling Kim B
Home Financials for this Owner
Home Financials are based on the most recent Mortgage that was taken out on this home.
Original Mortgage
$675,000
Interest Rate
7.47%
Create a Home Valuation Report for This Property
The Home Valuation Report is an in-depth analysis detailing your home's value as well as a comparison with similar homes in the area
Home Values in the Area
Average Home Value in this Area
Purchase History
| Date | Buyer | Sale Price | Title Company |
|---|---|---|---|
| Robert K Elling Trust | -- | None Listed On Document | |
| Elling Kim | -- | -- | |
| Elling Robert K | $900,000 | -- |
Source: Public Records
Mortgage History
| Date | Status | Borrower | Loan Amount |
|---|---|---|---|
| Previous Owner | Elling Kim | $548,250 | |
| Previous Owner | Elling Kim | $348,154 | |
| Previous Owner | Elling Kim | -- | |
| Previous Owner | Elling Robert K | $675,000 |
Source: Public Records
Tax History
| Year | Tax Paid | Tax Assessment Tax Assessment Total Assessment is a certain percentage of the fair market value that is determined by local assessors to be the total taxable value of land and additions on the property. | Land | Improvement |
|---|---|---|---|---|
| 2025 | $18,091 | $2,685,033 | -- | -- |
| 2024 | $18,091 | $2,628,200 | $2,156,000 | $472,200 |
Source: Public Records
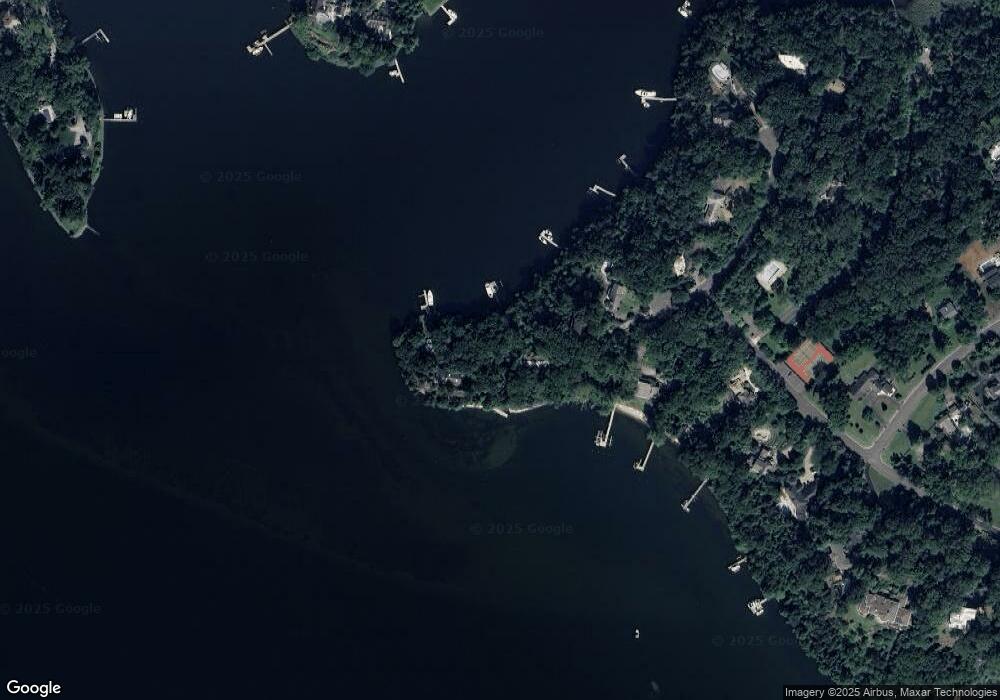
Map
Nearby Homes
- 1230 Balfour Dr
- 769 Robinhood Rd
- 812 Coachway
- 1199 Asquithpines Place
- 1277 Ritchie Hwy Unit 195
- 856 St Edmonds Place
- 1254 Dogwood Rd
- 1350 Ritchie Hwy
- 1294 Circle Dr
- 1232 Taylor Ave
- 1486 Downham Market
- 1396 Baltimore Annapolis Blvd
- 1394 Baltimore Annapolis Blvd
- 349 Sherwood Trail
- 357 Overlook Trail
- 165 Severn Way
- 208 Admirals Ct
- 1727 Broadlee Trail
- 939 Kinhart Ct
- 1465 Ridgeway
- 1276 Fenwick Garth
- 1270 Fenwick Garth
- 1288 Fenwick Garth
- 1264 Fenwick Garth
- 1294 Kinloch Cir
- 1258 Fenwick Garth
- 1300 Kinloch Cir
- 1222 Fenwick Garth
- 1135 Asquith Dr
- 1306 Kinloch Cir
- 1137 Asquith Dr
- 1133 Asquith Dr
- 1246 Fenwick Garth
- 230 Glen Oban Dr
- 1312 Kinloch Cir
- 318 Rugby Cove
- 1228 Fenwick Garth
- 1128 Asquith Dr
- 1131 Asquith Dr
- 1240 Fenwick Garth
Your Personal Tour Guide
Ask me questions while you tour the home.