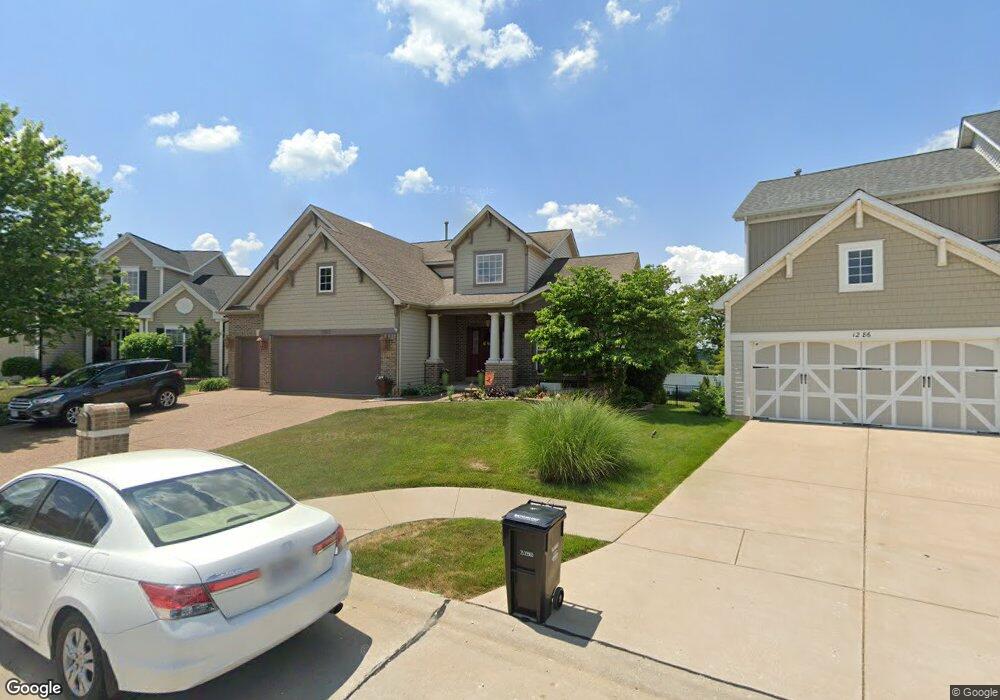
1282 Hawkins Bend Ct Fenton, MO 63026
Estimated Value: $518,561 - $570,000
4
Beds
3
Baths
2,544
Sq Ft
$215/Sq Ft
Est. Value
About This Home
This home is located at 1282 Hawkins Bend Ct, Fenton, MO 63026 and is currently estimated at $546,140, approximately $214 per square foot. 1282 Hawkins Bend Ct is a home located in St. Louis County with nearby schools including Kellison Elementary School, Rockwood South Middle School, and Rockwood Summit Senior High School.
Ownership History
Date
Name
Owned For
Owner Type
Purchase Details
Closed on
May 7, 2013
Sold by
Hager Lynn E and Hager Michael D
Bought by
Hager Michael D and Hager Lynn E
Current Estimated Value
Home Financials for this Owner
Home Financials are based on the most recent Mortgage that was taken out on this home.
Original Mortgage
$173,500
Outstanding Balance
$123,659
Interest Rate
3.61%
Mortgage Type
New Conventional
Estimated Equity
$422,481
Purchase Details
Closed on
Nov 6, 2006
Sold by
Consort Homes Llc
Bought by
Hager Michael D and Hager Lynn E
Home Financials for this Owner
Home Financials are based on the most recent Mortgage that was taken out on this home.
Original Mortgage
$109,000
Interest Rate
6.28%
Mortgage Type
Credit Line Revolving
Create a Home Valuation Report for This Property
The Home Valuation Report is an in-depth analysis detailing your home's value as well as a comparison with similar homes in the area
Home Values in the Area
Average Home Value in this Area
Purchase History
| Date | Buyer | Sale Price | Title Company |
|---|---|---|---|
| Hager Michael D | -- | -- | |
| Hager Michael D | -- | -- | |
| Hager Michael D | $372,605 | Sec |
Source: Public Records
Mortgage History
| Date | Status | Borrower | Loan Amount |
|---|---|---|---|
| Open | Hager Michael D | $173,500 | |
| Closed | Hager Michael D | $173,500 | |
| Previous Owner | Hager Michael D | $109,000 | |
| Previous Owner | Hager Michael D | $183,500 |
Source: Public Records
Tax History Compared to Growth
Tax History
| Year | Tax Paid | Tax Assessment Tax Assessment Total Assessment is a certain percentage of the fair market value that is determined by local assessors to be the total taxable value of land and additions on the property. | Land | Improvement |
|---|---|---|---|---|
| 2025 | $6,058 | $82,910 | $20,270 | $62,640 |
| 2024 | $6,058 | $81,420 | $17,370 | $64,050 |
| 2023 | $6,053 | $81,420 | $17,370 | $64,050 |
| 2022 | $5,635 | $70,620 | $10,850 | $59,770 |
| 2021 | $5,592 | $70,620 | $10,850 | $59,770 |
| 2020 | $5,630 | $68,370 | $10,130 | $58,240 |
| 2019 | $5,647 | $68,370 | $10,130 | $58,240 |
| 2018 | $5,150 | $59,810 | $14,460 | $45,350 |
| 2017 | $5,109 | $59,810 | $14,460 | $45,350 |
| 2016 | $4,639 | $54,820 | $14,460 | $40,360 |
| 2015 | $4,543 | $54,820 | $14,460 | $40,360 |
| 2014 | $4,556 | $53,600 | $15,370 | $38,230 |
Source: Public Records
Map
Nearby Homes
- 1095 Hawkins Rd
- The Westhampton Plan at Oak Ridge Place
- 1218 Feliz Ln
- 1222 Perdiz Ln
- 1376 Remington Oaks Terrace
- 6 Hickory Hollow Ln
- 1185 Scheel Ln
- 1305 Trails Dr
- 1564 Codorniz Ln
- 1009 Remington Oaks Ct
- 1401 Windrider Ct
- 108 E Lark Dr
- 108 Cherry Hill Dr
- 1221 Newport Landing Dr
- 4 Dixie Dr
- 811 Mary Lee Ct
- The Westhampton Plan at Hawkins Point
- The Rockport Plan at Hawkins Point
- The Brookfield Plan at Hawkins Point
- The Liberty Plan at Hawkins Point
- 1278 Hawkins Bend Ct
- 1286 Hawkins Bend Ct
- 1290 Hawkins Bend Ct
- 1289 Hawkins Bend Ct
- 1294 Hawkins Bend Ct
- 1277 Hawkins Bend Ct
- 1281 Hawkins Bend Ct
- 1270 Hawkins Bend Ct
- 1277 Hawkins Bend (Cont To Show)
- 1090 Hawkins Bend Dr
- 1293 Hawkins Bend Ct
- 1255 Lake Canyon View
- 1405 Hawkins Meadow Dr
- 1401 Hawkins Meadow Dr
- 1409 Hawkins Meadow Dr
- 1413 Hawkins Meadow Dr
- 1081 Hawkins Bend Dr
- 1202 Hawkins Rd
- 1264 Lake Canyon View
- 1251 Lake Canyon View