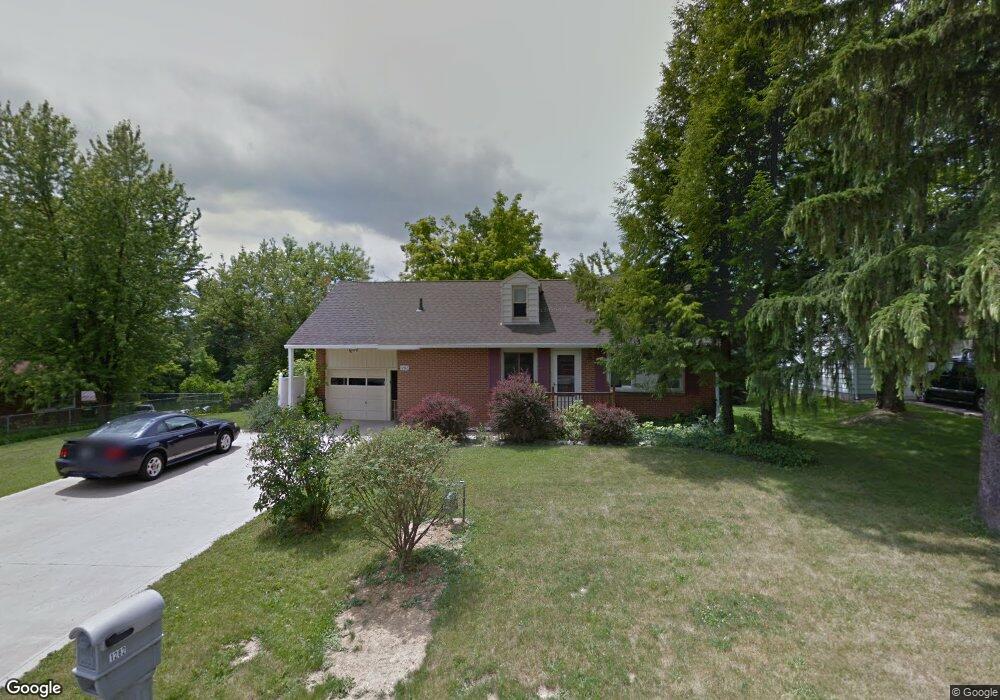
1282 Knapp Rd Mansfield, OH 44907
Estimated Value: $188,059 - $252,000
3
Beds
2
Baths
1,616
Sq Ft
$132/Sq Ft
Est. Value
About This Home
This home is located at 1282 Knapp Rd, Mansfield, OH 44907 and is currently estimated at $212,515, approximately $131 per square foot. 1282 Knapp Rd is a home located in Richland County with nearby schools including Lexington High School, Mansfield Christian School, and Discovery School.
Ownership History
Date
Name
Owned For
Owner Type
Purchase Details
Closed on
Jun 11, 2019
Sold by
Wemyss Leslie R
Bought by
Wemyss Curt J and Wemyss Janice K
Current Estimated Value
Purchase Details
Closed on
Dec 13, 2010
Sold by
Federal Home Loan Mortgage Corporation
Bought by
Wemyss Leslie R
Purchase Details
Closed on
Oct 26, 2010
Sold by
Irvin Steven and Irvin Rebekah L
Bought by
Federal Home Loan Mortgage Corp
Purchase Details
Closed on
Mar 2, 1999
Sold by
Walters James R
Bought by
Irvin Steven W and Irvin Becky L
Home Financials for this Owner
Home Financials are based on the most recent Mortgage that was taken out on this home.
Original Mortgage
$87,608
Interest Rate
6.92%
Mortgage Type
FHA
Create a Home Valuation Report for This Property
The Home Valuation Report is an in-depth analysis detailing your home's value as well as a comparison with similar homes in the area
Home Values in the Area
Average Home Value in this Area
Purchase History
| Date | Buyer | Sale Price | Title Company |
|---|---|---|---|
| Wemyss Curt J | $40,000 | None Available | |
| Wemyss Leslie R | $60,000 | Southern Title | |
| Federal Home Loan Mortgage Corp | $54,667 | None Available | |
| Irvin Steven W | $88,500 | -- |
Source: Public Records
Mortgage History
| Date | Status | Borrower | Loan Amount |
|---|---|---|---|
| Previous Owner | Irvin Steven W | $87,608 |
Source: Public Records
Tax History Compared to Growth
Tax History
| Year | Tax Paid | Tax Assessment Tax Assessment Total Assessment is a certain percentage of the fair market value that is determined by local assessors to be the total taxable value of land and additions on the property. | Land | Improvement |
|---|---|---|---|---|
| 2024 | $2,112 | $43,200 | $8,670 | $34,530 |
| 2023 | $2,112 | $43,200 | $8,670 | $34,530 |
| 2022 | $1,661 | $29,250 | $6,890 | $22,360 |
| 2021 | $1,667 | $29,250 | $6,890 | $22,360 |
| 2020 | $1,669 | $29,250 | $6,890 | $22,360 |
| 2019 | $1,533 | $24,790 | $5,840 | $18,950 |
| 2018 | $1,305 | $24,790 | $5,840 | $18,950 |
| 2017 | $1,203 | $24,790 | $5,840 | $18,950 |
| 2016 | $1,115 | $21,000 | $7,910 | $13,090 |
| 2015 | $1,113 | $21,000 | $7,910 | $13,090 |
| 2014 | $1,115 | $21,000 | $7,910 | $13,090 |
| 2012 | $1,050 | $21,000 | $7,910 | $13,090 |
Source: Public Records
Map
Nearby Homes
- 478 Clearview Rd
- 646 Kennedy Dr
- 0 U S Highway 42
- 484 Beechwood Dr
- 501 Clifton Blvd
- 0 Lexington Ave Unit 224009661
- 1689 Middle Bellville Rd
- 823 Red Oak Trail Unit 2
- 823 1 2 Red Oak Trail
- 1125 Larchwood Rd
- 823 1/2 Red Oak Trail
- 1702 Middle Bellville Rd
- 654 Courtwright Blvd
- 1690 Riva Ridge Dr Unit 1690
- 0 Rippling Brook Dr
- 1696 Riva Ridge Dr
- 1156 Yorkwood Rd
- 1698 Riva Ridge Dr Unit 1698
- 1009 Woodhill Rd
- 1720 Rippling Brook Dr
- 1287 Lehnhart Dr
- 1272 Knapp Rd
- 1292 Knapp Rd
- 1273 Lehnhart Dr
- 1283 Knapp Rd
- 1273 Knapp Rd
- 1293 Knapp Rd
- 1262 Knapp Rd
- 1302 Knapp Rd
- 1263 Lehnhart Dr
- 1313 Knapp Rd
- 1282 Lehnhart Dr
- 1292 Lehnhart Dr
- 1263 Knapp Rd
- 1272 Lehnhart Dr
- 1312 Knapp Rd
- 1252 Knapp Rd
- 1323 Knapp Rd
- 1253 Lehnhart Dr
- 1262 Lehnhart Dr