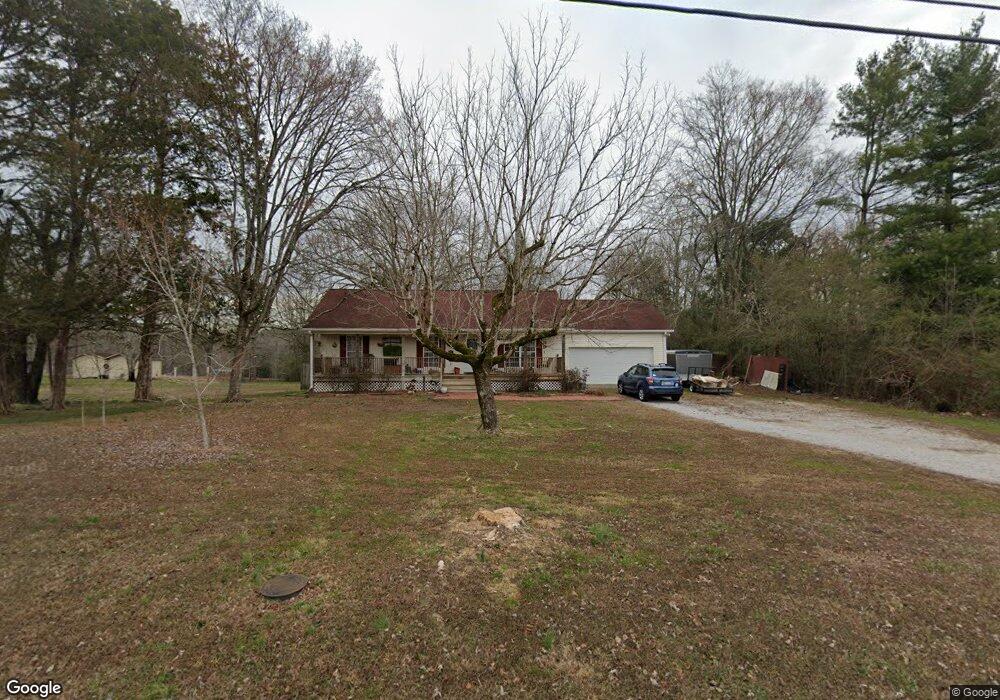
1282 Nellie Head Rd Tunnel Hill, GA 30755
Keith NeighborhoodEstimated Value: $227,000 - $253,000
--
Bed
2
Baths
1,314
Sq Ft
$180/Sq Ft
Est. Value
About This Home
This home is located at 1282 Nellie Head Rd, Tunnel Hill, GA 30755 and is currently estimated at $236,936, approximately $180 per square foot. 1282 Nellie Head Rd is a home located in Catoosa County with nearby schools including Tiger Creek Elementary School, Ringgold Middle School, and Ringgold High School.
Ownership History
Date
Name
Owned For
Owner Type
Purchase Details
Closed on
Jun 3, 2013
Sold by
Creamer James J
Bought by
Creamer James J and Creamer Amy C
Current Estimated Value
Purchase Details
Closed on
Mar 15, 2010
Sold by
Creamer James J
Bought by
Stuttgart1080
Purchase Details
Closed on
Feb 26, 2007
Sold by
Queen Ronnie G
Bought by
Creamer James J
Home Financials for this Owner
Home Financials are based on the most recent Mortgage that was taken out on this home.
Original Mortgage
$130,000
Interest Rate
6.19%
Mortgage Type
New Conventional
Purchase Details
Closed on
Jan 10, 2003
Bought by
Queen Ronnie G And
Create a Home Valuation Report for This Property
The Home Valuation Report is an in-depth analysis detailing your home's value as well as a comparison with similar homes in the area
Home Values in the Area
Average Home Value in this Area
Purchase History
| Date | Buyer | Sale Price | Title Company |
|---|---|---|---|
| Creamer James J | -- | -- | |
| Stuttgart1080 | -- | -- | |
| Creamer James J | $130,000 | -- | |
| Queen Ronnie G And | -- | -- |
Source: Public Records
Mortgage History
| Date | Status | Borrower | Loan Amount |
|---|---|---|---|
| Previous Owner | Creamer James J | $130,000 |
Source: Public Records
Tax History Compared to Growth
Tax History
| Year | Tax Paid | Tax Assessment Tax Assessment Total Assessment is a certain percentage of the fair market value that is determined by local assessors to be the total taxable value of land and additions on the property. | Land | Improvement |
|---|---|---|---|---|
| 2024 | $1,894 | $88,789 | $7,102 | $81,687 |
| 2023 | $1,496 | $66,807 | $3,564 | $63,243 |
| 2022 | $1,114 | $49,756 | $3,395 | $46,361 |
| 2021 | $1,041 | $49,756 | $3,395 | $46,361 |
| 2020 | $1,023 | $44,191 | $3,233 | $40,958 |
| 2019 | $1,034 | $44,191 | $3,233 | $40,958 |
| 2018 | $1,092 | $44,191 | $3,233 | $40,958 |
| 2017 | $1,070 | $43,315 | $3,233 | $40,082 |
| 2016 | $1,052 | $40,473 | $3,233 | $37,240 |
| 2015 | -- | $40,473 | $3,233 | $37,240 |
| 2014 | -- | $43,940 | $6,700 | $37,240 |
| 2013 | -- | $43,940 | $6,700 | $37,240 |
Source: Public Records
Map
Nearby Homes
- 1412 Keith Rd
- 234 Bonavista Ln
- 230 Appaloosa Dr
- 293 Appaloosa Dr
- 421 Saddle Horse Cir
- 352 Saddle Horse Cir
- 492 Nellie Head Rd
- 479 Cooper Rd
- 9 Stonegate Place
- 0 Cooper Rd Unit 1522624
- 0 Cooper Rd Unit 131107
- 831 Tunnel Hill Rd
- 545 Salem Valley Rd
- 1023 Keith Salem Rd
- 175 Promise Heights Dr
- 0 Cherokee Lake Dr Unit 7323809
- 0 Cherokee Lake Dr Unit 129187
- 1370 &1372 Peggy Ln
- 1370 Peggy Ln Unit s A & B
- 1360 Peggy Ln
- 1318 Nellie Head Rd
- 1275 Nellie Head Rd
- 1295 Nellie Head Rd
- 1322 Nellie Head Rd
- 1241 Nellie Head Rd
- 1476 Keith Rd
- 1230 Nellie Head Rd
- 1248 Nellie Head Rd
- 51 Cougar Ln
- 1198 Nellie Head Rd
- 1507 Keith Rd
- 1189 Nellie Head Rd
- 1447 Keith Rd
- 1620 Keith Rd
- 1531 Keith Rd
- 1160 Nellie Head Rd
- 1421 Keith Rd
- 1158 Nellie Head Rd
- 1155 Nellie Head Rd
- 2125 Keith Rd