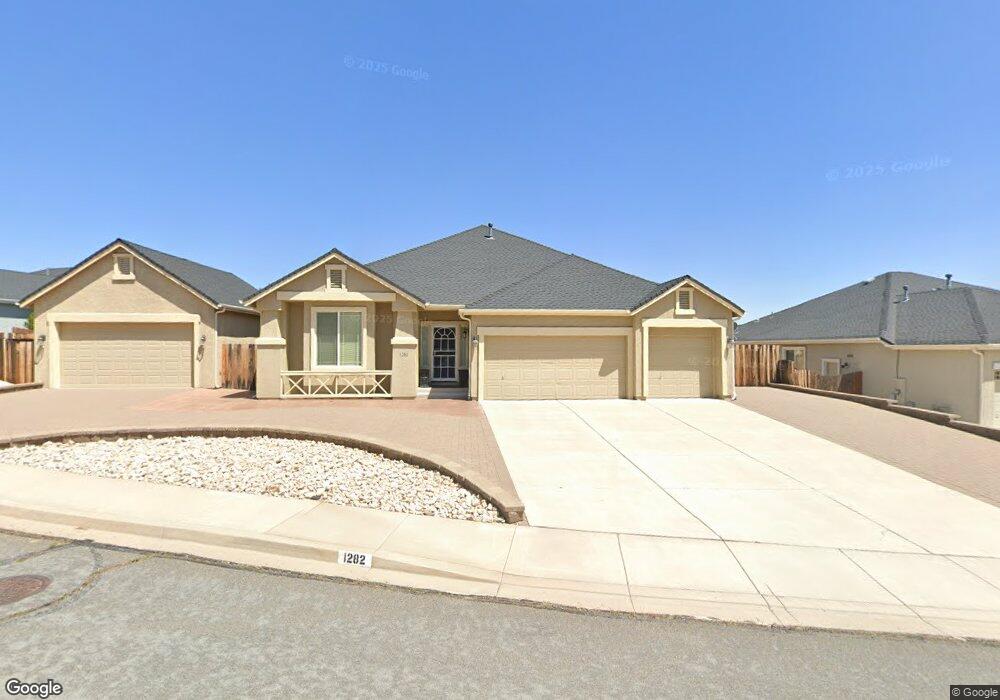
1282 Weizen Dr Sparks, NV 89441
Eagle Canyon-Pebble Creek NeighborhoodEstimated Value: $636,000 - $716,000
4
Beds
3
Baths
2,502
Sq Ft
$274/Sq Ft
Est. Value
About This Home
This home is located at 1282 Weizen Dr, Sparks, NV 89441 and is currently estimated at $684,592, approximately $273 per square foot. 1282 Weizen Dr is a home located in Washoe County with nearby schools including Jesse Hall Elementery School, Yvonne Shaw Middle School, and Spanish Springs High School.
Ownership History
Date
Name
Owned For
Owner Type
Purchase Details
Closed on
May 14, 2024
Sold by
Sieber William H
Bought by
William H Sieber Separate Property Trust and Sieber
Current Estimated Value
Purchase Details
Closed on
Dec 15, 2005
Sold by
Lennar Reno Llc
Bought by
Sieber William H
Home Financials for this Owner
Home Financials are based on the most recent Mortgage that was taken out on this home.
Original Mortgage
$250,000
Interest Rate
6.31%
Mortgage Type
Fannie Mae Freddie Mac
Purchase Details
Closed on
Dec 1, 2005
Sold by
Sieber Paulette C
Bought by
Sieber William H
Home Financials for this Owner
Home Financials are based on the most recent Mortgage that was taken out on this home.
Original Mortgage
$250,000
Interest Rate
6.31%
Mortgage Type
Fannie Mae Freddie Mac
Create a Home Valuation Report for This Property
The Home Valuation Report is an in-depth analysis detailing your home's value as well as a comparison with similar homes in the area
Home Values in the Area
Average Home Value in this Area
Purchase History
| Date | Buyer | Sale Price | Title Company |
|---|---|---|---|
| William H Sieber Separate Property Trust | -- | None Listed On Document | |
| Sieber William H | $435,500 | Ticor Title Of Nevada Inc | |
| Sieber William H | -- | Ticor Title Of Nevada Inc |
Source: Public Records
Mortgage History
| Date | Status | Borrower | Loan Amount |
|---|---|---|---|
| Previous Owner | Sieber William H | $250,000 |
Source: Public Records
Tax History
| Year | Tax Paid | Tax Assessment Tax Assessment Total Assessment is a certain percentage of the fair market value that is determined by local assessors to be the total taxable value of land and additions on the property. | Land | Improvement |
|---|---|---|---|---|
| 2026 | -- | $165,066 | $47,425 | $117,641 |
| 2024 | $3,670 | $161,040 | $40,495 | $120,545 |
| 2023 | $3,564 | $156,692 | $43,015 | $113,677 |
| 2022 | $3,460 | $129,719 | $36,085 | $93,634 |
| 2021 | $3,360 | $125,032 | $31,500 | $93,532 |
| 2020 | $3,260 | $123,740 | $30,100 | $93,640 |
| 2019 | $3,165 | $117,901 | $27,125 | $90,776 |
| 2018 | $3,073 | $109,845 | $21,350 | $88,495 |
| 2017 | $2,984 | $108,398 | $19,845 | $88,553 |
| 2016 | $2,908 | $109,165 | $18,795 | $90,370 |
| 2015 | $2,902 | $107,151 | $17,045 | $90,106 |
| 2014 | $2,818 | $92,773 | $14,490 | $78,283 |
| 2013 | -- | $84,327 | $11,410 | $72,917 |
Source: Public Records
Map
Nearby Homes
- 1247 Fuggles Dr
- 65 Rook Ct
- 2125 Lenticular Dr
- 1055 Spoonbill Dr
- 1359 Nightingale Way Unit 4
- Ginger Plan at Cinnamon Ridge
- Anise Elite Plan at Cinnamon Ridge
- Caraway Elite Plan at Cinnamon Ridge
- Anise Plan at Cinnamon Ridge
- Caraway Plan at Cinnamon Ridge
- Nutmeg Plan at Cinnamon Ridge
- 952 Red Falcon Way
- 1023 Carico Valley Place
- 1030 Garden Pond Way
- 1675 Talking Sparrow Dr
- 2940 Murrelet Way Unit Cinnamon 83
- 2400 Arrowroot Way
- 2400 Arrowroot Way Unit Cinnamon 84
- 3121 Thrasher St Unit Cinnamon 147
- 1981 Lanstar Dr
- 1296 Weizen Dr
- 1268 Weizen Dr Unit 5
- 1310 Weizen Dr
- 1281 Dortmunder Dr
- 1267 Dortmunder Dr
- 1309 Weizen Dr
- 1295 Weizen Dr
- 1281 Weizen Dr
- 1267 Weizen Dr
- 1295 Dortmunder Dr
- 1274 Lambic Dr
- 1260 Lambic Dr
- 1324 Weizen Dr
- 1288 Lambic Dr
- 1323 Weizen Dr Unit 6
- 1246 Lambic Dr
- 1302 Lambic Dr
- 1338 Weizen Dr
- 1308 Hallertau Dr
- 1309 Dortmunder Dr
Your Personal Tour Guide
Ask me questions while you tour the home.