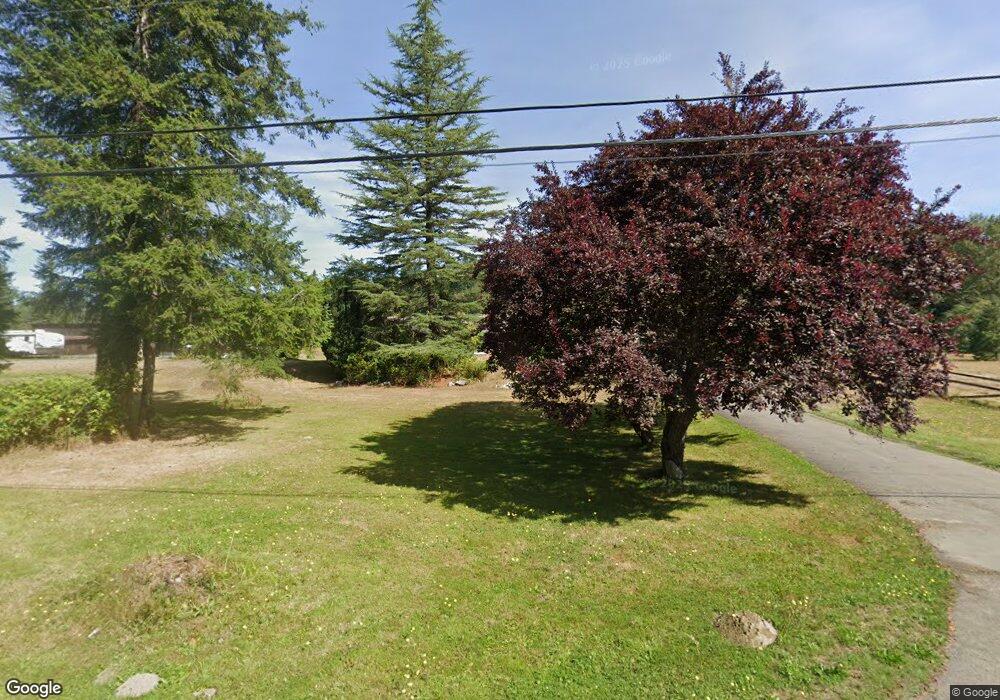
12825 Trout Farm Rd Sultan, WA 98294
Estimated Value: $483,000 - $608,000
3
Beds
1
Bath
1,622
Sq Ft
$344/Sq Ft
Est. Value
About This Home
This home is located at 12825 Trout Farm Rd, Sultan, WA 98294 and is currently estimated at $557,179, approximately $343 per square foot. 12825 Trout Farm Rd is a home located in Snohomish County with nearby schools including Sultan Senior High School.
Ownership History
Date
Name
Owned For
Owner Type
Purchase Details
Closed on
Mar 7, 2023
Sold by
Botting Scott
Bought by
Johnson Jason
Current Estimated Value
Home Financials for this Owner
Home Financials are based on the most recent Mortgage that was taken out on this home.
Original Mortgage
$418,500
Outstanding Balance
$405,267
Interest Rate
6.09%
Mortgage Type
New Conventional
Estimated Equity
$151,912
Purchase Details
Closed on
Jan 2, 2023
Sold by
Morris Dorothy Marion and Frank Morris Decedents Trust
Bought by
Botting Scott
Purchase Details
Closed on
Dec 20, 2012
Sold by
Morris Dorothy Marion and Frank Morris Decedents Trust
Bought by
Macdonald Gordon G
Purchase Details
Closed on
Dec 21, 2006
Sold by
Morris Dorothy Marion and Morris Frank
Bought by
Morris Dorothy Marion and Frank Morris Decedents Trust
Create a Home Valuation Report for This Property
The Home Valuation Report is an in-depth analysis detailing your home's value as well as a comparison with similar homes in the area
Home Values in the Area
Average Home Value in this Area
Purchase History
| Date | Buyer | Sale Price | Title Company |
|---|---|---|---|
| Johnson Jason | -- | Fidelity National Title | |
| Botting Scott | $455,000 | Chicago Title | |
| Macdonald Gordon G | $5,280 | Chicago Title | |
| Morris Dorothy Marion | -- | None Available | |
| Morris Dorothy Marion | -- | None Available |
Source: Public Records
Mortgage History
| Date | Status | Borrower | Loan Amount |
|---|---|---|---|
| Open | Johnson Jason | $418,500 |
Source: Public Records
Tax History Compared to Growth
Tax History
| Year | Tax Paid | Tax Assessment Tax Assessment Total Assessment is a certain percentage of the fair market value that is determined by local assessors to be the total taxable value of land and additions on the property. | Land | Improvement |
|---|---|---|---|---|
| 2025 | $4,075 | $453,200 | $340,200 | $113,000 |
| 2024 | $4,075 | $448,200 | $335,200 | $113,000 |
| 2023 | $4,702 | $613,500 | $377,700 | $235,800 |
| 2022 | $443 | $424,200 | $245,100 | $179,100 |
| 2020 | $495 | $355,500 | $210,100 | $145,400 |
| 2019 | $518 | $342,100 | $204,400 | $137,700 |
| 2018 | $382 | $282,700 | $145,000 | $137,700 |
| 2017 | $418 | $188,700 | $65,000 | $123,700 |
| 2016 | $433 | $184,900 | $65,000 | $119,900 |
| 2015 | $459 | $171,100 | $65,000 | $106,100 |
| 2013 | $486 | $154,800 | $65,000 | $89,800 |
Source: Public Records
Map
Nearby Homes
- 207 Willow Ave
- 12138 Cobble Hill Dr SE
- 0 Trout Farm Rd Unit NWM2457005
- 31207 123rd St SE
- 1528 Gohr Rd
- 31223 123rd St SE
- 405 Amberwood Cir
- 31219 122nd St SE
- 31233 122nd St SE
- 12017 289th Dr SE
- 870 4th St
- 31620 Winston St SE
- 12523 Woods Lake Rd
- 12029 317th Dr SE
- 12010 317th Ave SE
- 907 Bryant Rd
- 512 1st St
- 1338 Cascade St
- 507 3rd St
- 0 132nd St SE
- 12825 Trout Farm Rd
- 12825 Trout Farm Rd
- 12825 Trout Farm Rd
- 0 XXX Trout Farm Rd
- 127 xxx Trout Farm Rd
- 3 Trout Farm Rd
- 19828 Trout Farm Rd
- 0 L1 Trout Farm Rd
- 0 L3 Trout Farm Rd
- 0 L2 Trout Farm Rd
- 12826 Trout Farm Rd
- 0 Lot 6 302nd Dr SE
- 12912 302nd Dr SE
- 12904 Trout Farm Rd
- 12911 302nd Dr SE
- 12918 302nd Dr SE
- 12919 302nd Dr SE
- 12914 303rd Dr SE
- 2 Trout Farm Rd
- 12920 303rd Dr SE