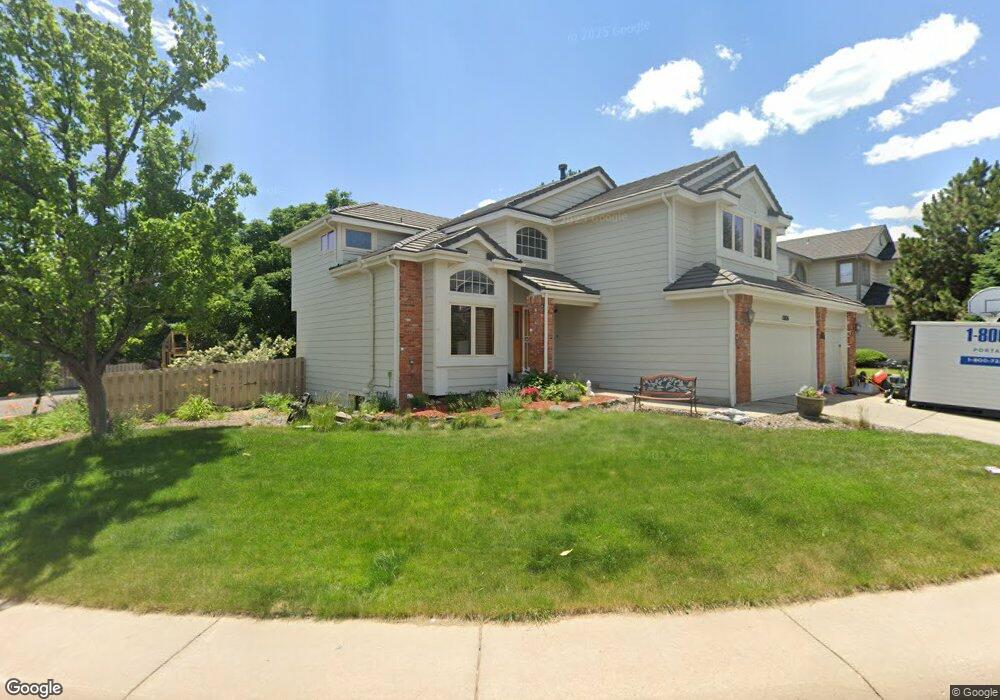
12826 W Iliff Dr Denver, CO 80228
Hutchinson Green Mountain NeighborhoodEstimated Value: $905,232 - $1,004,000
4
Beds
4
Baths
3,322
Sq Ft
$285/Sq Ft
Est. Value
About This Home
This home is located at 12826 W Iliff Dr, Denver, CO 80228 and is currently estimated at $946,058, approximately $284 per square foot. 12826 W Iliff Dr is a home located in Jefferson County with nearby schools including Devinny Elementary School, Dunstan Middle School, and Green Mountain High School.
Ownership History
Date
Name
Owned For
Owner Type
Purchase Details
Closed on
Feb 28, 2019
Sold by
Hancock John William and Hancock Michelle Anne
Bought by
Sakal Heng and Sjoholm Heng Anika
Current Estimated Value
Home Financials for this Owner
Home Financials are based on the most recent Mortgage that was taken out on this home.
Original Mortgage
$560,250
Outstanding Balance
$492,555
Interest Rate
4.4%
Mortgage Type
New Conventional
Estimated Equity
$453,503
Create a Home Valuation Report for This Property
The Home Valuation Report is an in-depth analysis detailing your home's value as well as a comparison with similar homes in the area
Home Values in the Area
Average Home Value in this Area
Purchase History
| Date | Buyer | Sale Price | Title Company |
|---|---|---|---|
| Sakal Heng | $622,500 | North American Title |
Source: Public Records
Mortgage History
| Date | Status | Borrower | Loan Amount |
|---|---|---|---|
| Open | Sakal Heng | $560,250 |
Source: Public Records
Tax History Compared to Growth
Tax History
| Year | Tax Paid | Tax Assessment Tax Assessment Total Assessment is a certain percentage of the fair market value that is determined by local assessors to be the total taxable value of land and additions on the property. | Land | Improvement |
|---|---|---|---|---|
| 2024 | $5,054 | $51,606 | $22,147 | $29,459 |
| 2023 | $5,054 | $51,606 | $22,147 | $29,459 |
| 2022 | $4,518 | $45,288 | $19,918 | $25,370 |
| 2021 | $4,575 | $46,591 | $20,491 | $26,100 |
| 2020 | $3,721 | $37,982 | $16,416 | $21,566 |
| 2019 | $3,675 | $37,982 | $16,416 | $21,566 |
| 2018 | $3,888 | $38,805 | $14,728 | $24,077 |
| 2017 | $3,549 | $38,805 | $14,728 | $24,077 |
| 2016 | $3,470 | $36,609 | $11,169 | $25,440 |
| 2015 | $3,335 | $36,609 | $11,169 | $25,440 |
| 2014 | $3,335 | $33,002 | $10,189 | $22,813 |
Source: Public Records
Map
Nearby Homes
- 13126 W Warren Cir
- 2164 S Zang Way
- 2037 S Welch Cir
- 12807 W Adriatic Ave
- 2061 S Youngfield St
- 2703 S Cole Ct
- 13126 W Jewell Cir
- 12711 W Jewell Cir
- 1882 S Zinnia Way
- 2914 S Deframe Way
- 2540 S Deframe St
- 2175 S Deframe St
- 13815 W Amherst Way
- 2675 S Deframe Cir
- 2663 S Deframe Cir
- 13233 W Utah Cir
- 13804 W Iliff Ave
- 11904 W Auburn Dr
- 1825 S Zang Ct
- 2336 S Eldridge Ct
- 12876 W Iliff Dr
- 12886 W Iliff Dr
- 12827 W Iliff Dr
- 2344 S Yank Cir
- 12837 W Iliff Dr
- 12807 W Iliff Dr
- 2352 S Yank St
- 12857 W Iliff Dr
- 12906 W Iliff Dr
- 2345 S Yank Cir
- 2332 S Yank St
- 2353 S Yank St
- 2364 S Yank Cir
- 12936 W Iliff Dr
- 2343 S Yank St
- 2355 S Yank Cir
- 2495 S Yank Cir
- 2312 S Yank St
- 12946 W Iliff Dr
- 13134 W Yale Place