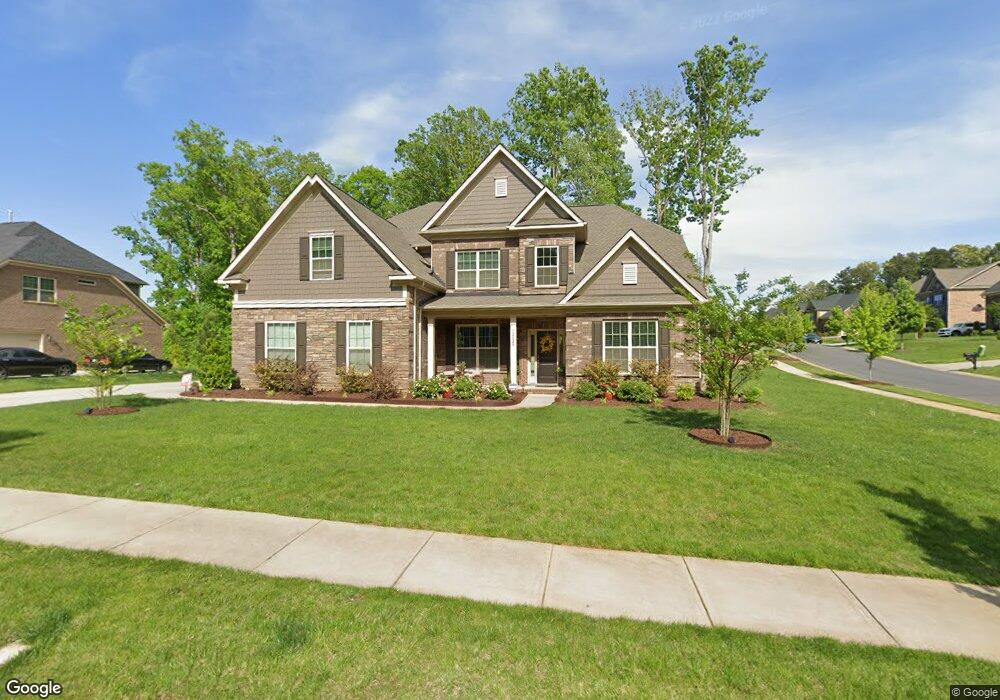
12828 Pumpkin Way Dr Mint Hill, NC 28227
Estimated Value: $765,000 - $840,000
5
Beds
3
Baths
3,552
Sq Ft
$226/Sq Ft
Est. Value
About This Home
This home is located at 12828 Pumpkin Way Dr, Mint Hill, NC 28227 and is currently estimated at $801,018, approximately $225 per square foot. 12828 Pumpkin Way Dr is a home located in Mecklenburg County with nearby schools including Bain Elementary, Mint Hill Middle School, and Independence High.
Ownership History
Date
Name
Owned For
Owner Type
Purchase Details
Closed on
Aug 28, 2025
Sold by
Williams Tamara Strong and Williams Raymon
Bought by
Strong Williams Tamara and Strong Raymon Williams
Current Estimated Value
Home Financials for this Owner
Home Financials are based on the most recent Mortgage that was taken out on this home.
Original Mortgage
$252,000
Outstanding Balance
$250,672
Interest Rate
6.72%
Mortgage Type
New Conventional
Estimated Equity
$550,346
Purchase Details
Closed on
Mar 11, 2024
Sold by
Earl Strong Richard and Atkinson Cheryl
Bought by
Strong Richard Earl and Atkinson Strong Cheryl
Purchase Details
Closed on
Jun 30, 2017
Sold by
Essex Homes Southesast Inc
Bought by
Strong Richard Earl and Strong Cheryl Atkinson
Home Financials for this Owner
Home Financials are based on the most recent Mortgage that was taken out on this home.
Original Mortgage
$175,000
Interest Rate
4.02%
Mortgage Type
New Conventional
Create a Home Valuation Report for This Property
The Home Valuation Report is an in-depth analysis detailing your home's value as well as a comparison with similar homes in the area
Home Values in the Area
Average Home Value in this Area
Purchase History
| Date | Buyer | Sale Price | Title Company |
|---|---|---|---|
| Strong Williams Tamara | -- | None Listed On Document | |
| Strong Richard Earl | -- | None Listed On Document | |
| Strong Richard Earl | -- | None Listed On Document | |
| Strong Richard Earl | $468,500 | None Available |
Source: Public Records
Mortgage History
| Date | Status | Borrower | Loan Amount |
|---|---|---|---|
| Open | Strong Williams Tamara | $252,000 | |
| Previous Owner | Strong Richard Earl | $175,000 |
Source: Public Records
Tax History
| Year | Tax Paid | Tax Assessment Tax Assessment Total Assessment is a certain percentage of the fair market value that is determined by local assessors to be the total taxable value of land and additions on the property. | Land | Improvement |
|---|---|---|---|---|
| 2025 | $5,038 | $704,500 | $140,000 | $564,500 |
| 2024 | $5,038 | $704,500 | $140,000 | $564,500 |
| 2023 | $4,963 | $704,500 | $140,000 | $564,500 |
| 2022 | $3,925 | $445,600 | $67,000 | $378,600 |
| 2021 | $3,925 | $445,600 | $67,000 | $378,600 |
| 2020 | $3,925 | $445,600 | $67,000 | $378,600 |
| 2019 | $3,919 | $445,600 | $67,000 | $378,600 |
| 2018 | $4,113 | $50,000 | $50,000 | $0 |
| 2017 | $543 | $50,000 | $50,000 | $0 |
| 2016 | -- | $100 | $100 | $0 |
Source: Public Records
Map
Nearby Homes
- 10315 Lemington Dr
- 9511 Liberty Hill Dr
- 9534 Liberty Hill Dr
- 9515 Liberty Hill Dr
- 3618 Marchers Trace Dr
- 3606 Marchers Trace Dr
- 9416 Stonebridge Way
- 8917 Dartmoor Place
- 9433 Stonebridge Way
- 3801 Cherrybrook Dr
- 8929 Lauriston Place
- 8811 Maplebrook Ln
- 3024 Marchers Trace Dr
- 12009 Wild Ginger Ln
- 9920 Stonebridge Way
- 8941 Blair Rd
- 8907 Euston Ct
- 7350 Purple Martin Way
- 7342 Purple Martin Way
- 9113 Brief Rd
- 11431 Three Sisters Ln Unit 310
- 12834 Pumpkin Way Dr
- 12823 Pumpkin Way Dr Unit 306
- 12829 Pumpkin Way Dr Unit 305
- 12829 Pumpkin Way Dr
- 11418 Three Sisters Ln
- 11423 3 Sisters Ln
- 12815 Pumpkin Way Dr Unit 307
- 12835 Pumpkin Way Dr Unit 304
- 12902 Pumpkin Way Dr
- 12804 Pumpkin Way Dr
- 11417 Three Sisters Ln
- 12807 Pumpkin Way Dr Unit 308
- 12905 Pumpkin Way Dr Unit 303
- 12908 Pumpkin Way Dr Unit 376
- 9005 Opal Crest Dr
- 9017 Opal Crest Dr
- 9011 Opal Crest Dr
- 11411 Three Sisters Ln
- 12911 Pumpkin Way Dr Unit 302
Your Personal Tour Guide
Ask me questions while you tour the home.