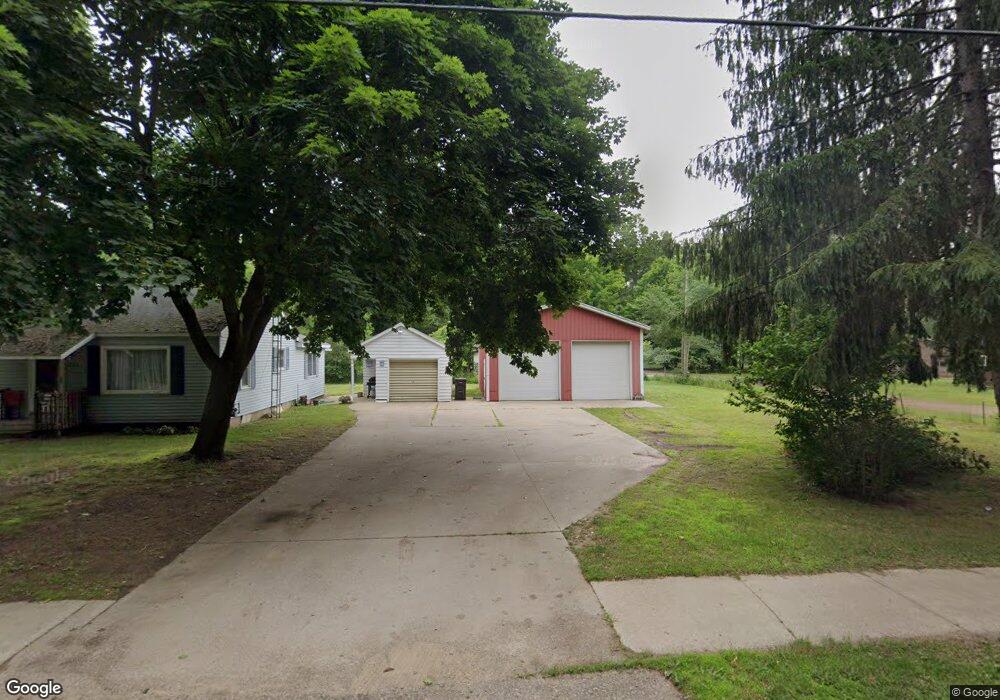
1283 Bridge Rd Allegan, MI 49010
Estimated Value: $193,568 - $257,000
2
Beds
1
Bath
1,008
Sq Ft
$222/Sq Ft
Est. Value
About This Home
This home is located at 1283 Bridge Rd, Allegan, MI 49010 and is currently estimated at $224,142, approximately $222 per square foot. 1283 Bridge Rd is a home located in Allegan County with nearby schools including Pine Trails Elementary School, L.E. White Middle School, and Allegan High School.
Ownership History
Date
Name
Owned For
Owner Type
Purchase Details
Closed on
Aug 1, 2024
Sold by
Knight Heather
Bought by
Knight Heather and Krusinga Slate
Current Estimated Value
Purchase Details
Closed on
Jun 28, 2017
Sold by
Milbocker Barbara A and Milbocker Edward C
Bought by
Knight Heather
Home Financials for this Owner
Home Financials are based on the most recent Mortgage that was taken out on this home.
Original Mortgage
$131,313
Interest Rate
3.95%
Mortgage Type
New Conventional
Purchase Details
Closed on
Mar 10, 1999
Sold by
Milbocker Edw and Milbocker Wf
Bought by
Milbocker Edward Et and Milbocker Al
Create a Home Valuation Report for This Property
The Home Valuation Report is an in-depth analysis detailing your home's value as well as a comparison with similar homes in the area
Purchase History
| Date | Buyer | Sale Price | Title Company |
|---|---|---|---|
| Knight Heather | -- | None Listed On Document | |
| Knight Heather | $129,900 | Chicago Title Of Mi Inc | |
| Milbocker Edward Et | -- | -- |
Source: Public Records
Mortgage History
| Date | Status | Borrower | Loan Amount |
|---|---|---|---|
| Previous Owner | Knight Heather | $131,313 |
Source: Public Records
Tax History
| Year | Tax Paid | Tax Assessment Tax Assessment Total Assessment is a certain percentage of the fair market value that is determined by local assessors to be the total taxable value of land and additions on the property. | Land | Improvement |
|---|---|---|---|---|
| 2025 | $1,800 | $71,600 | $11,900 | $59,700 |
| 2024 | $1,638 | $68,900 | $11,300 | $57,600 |
| 2023 | $1,638 | $60,900 | $9,000 | $51,900 |
| 2022 | $1,638 | $52,800 | $10,000 | $42,800 |
| 2020 | $1,517 | $46,000 | $8,000 | $38,000 |
| 2019 | $0 | $46,400 | $9,100 | $37,300 |
| 2018 | $0 | $43,900 | $8,900 | $35,000 |
| 2017 | $0 | $41,400 | $9,700 | $31,700 |
| 2016 | $0 | $33,500 | $5,200 | $28,300 |
| 2015 | -- | $33,500 | $5,200 | $28,300 |
| 2014 | -- | $31,800 | $5,700 | $26,100 |
| 2013 | -- | $29,900 | $5,000 | $24,900 |
Source: Public Records
Map
Nearby Homes
Your Personal Tour Guide
Ask me questions while you tour the home.