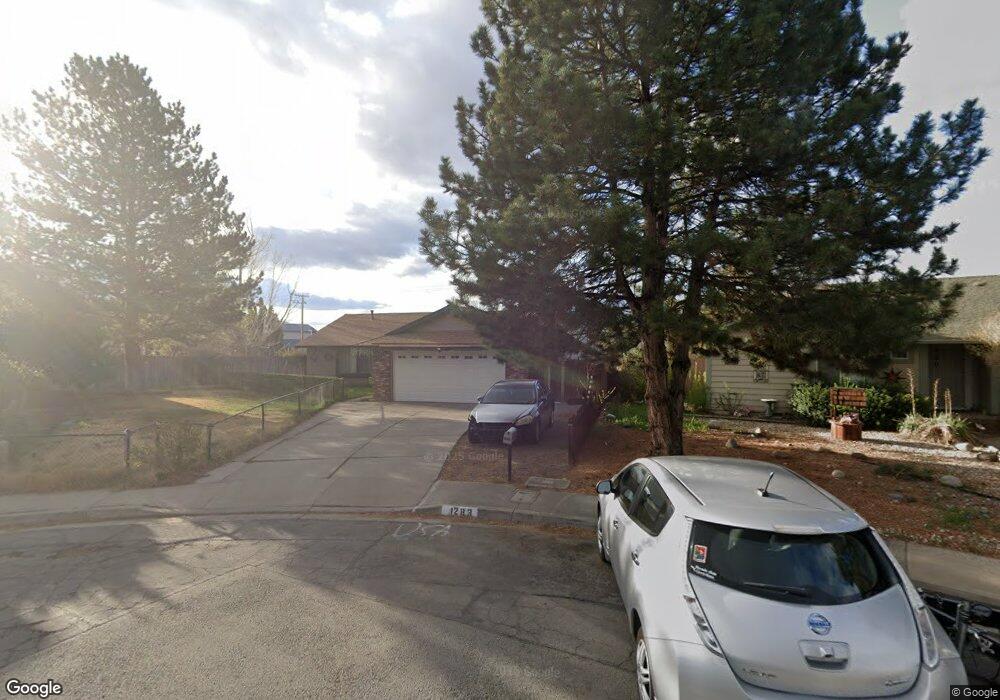
1283 Pullman Ct Sparks, NV 89434
O'Callaghan NeighborhoodEstimated Value: $436,000 - $481,000
3
Beds
2
Baths
1,397
Sq Ft
$322/Sq Ft
Est. Value
About This Home
This home is located at 1283 Pullman Ct, Sparks, NV 89434 and is currently estimated at $450,143, approximately $322 per square foot. 1283 Pullman Ct is a home located in Washoe County with nearby schools including Katherine Dunn Elementary School, George L Dilworth Middle School, and Edward C Reed High School.
Ownership History
Date
Name
Owned For
Owner Type
Purchase Details
Closed on
Dec 7, 2017
Sold by
Caer Domini Mario and Caer Domini Lorraine Le
Bought by
Ld & Md Llc
Current Estimated Value
Purchase Details
Closed on
Mar 4, 2011
Sold by
Domini Mario B and Domini Mario
Bought by
Caer Domini Mario and Caer Domini Lorraine Le
Purchase Details
Closed on
Nov 20, 2009
Sold by
Jpmc Specialty Mortgage Llc
Bought by
Sharing Domini Mario B and Nevada Lighting Profit Sharing Plan
Purchase Details
Closed on
Jul 18, 2009
Sold by
Mejorado Maria E
Bought by
Jpmc Speciality Mortgage Llc and Wm Speciality Mortgage Llc
Purchase Details
Closed on
Mar 31, 2006
Sold by
Swanson John W and Swanson Alyce I
Bought by
Mejorado Maria E
Home Financials for this Owner
Home Financials are based on the most recent Mortgage that was taken out on this home.
Original Mortgage
$216,160
Interest Rate
8.4%
Mortgage Type
Unknown
Create a Home Valuation Report for This Property
The Home Valuation Report is an in-depth analysis detailing your home's value as well as a comparison with similar homes in the area
Home Values in the Area
Average Home Value in this Area
Purchase History
| Date | Buyer | Sale Price | Title Company |
|---|---|---|---|
| Ld & Md Llc | -- | First Centennial Reno | |
| Caer Domini Mario | -- | First Centennial Reno | |
| Sharing Domini Mario B | $94,500 | Ticor Title Reno | |
| Jpmc Speciality Mortgage Llc | $100,000 | Lsi Title Agency Inc | |
| Mejorado Maria E | $270,500 | Western Title Incorporated |
Source: Public Records
Mortgage History
| Date | Status | Borrower | Loan Amount |
|---|---|---|---|
| Previous Owner | Mejorado Maria E | $216,160 |
Source: Public Records
Tax History
| Year | Tax Paid | Tax Assessment Tax Assessment Total Assessment is a certain percentage of the fair market value that is determined by local assessors to be the total taxable value of land and additions on the property. | Land | Improvement |
|---|---|---|---|---|
| 2026 | -- | $59,163 | $31,185 | $27,978 |
| 2024 | $1,574 | $61,087 | $31,089 | $29,999 |
| 2023 | $1,528 | $59,668 | $30,690 | $28,978 |
| 2022 | $1,485 | $49,326 | $24,705 | $24,621 |
| 2021 | $1,443 | $43,813 | $18,853 | $24,960 |
| 2020 | $1,354 | $44,237 | $18,786 | $25,451 |
| 2019 | $1,291 | $43,051 | $17,988 | $25,063 |
| 2018 | $1,234 | $38,171 | $13,267 | $24,904 |
| 2017 | $1,193 | $36,820 | $12,037 | $24,783 |
| 2016 | $1,162 | $36,450 | $10,840 | $25,610 |
| 2015 | $293 | $35,100 | $9,144 | $25,956 |
| 2014 | $1,125 | $33,147 | $7,814 | $25,333 |
| 2013 | -- | $30,092 | $6,090 | $24,002 |
Source: Public Records
Map
Nearby Homes
- 1357 Coupler Ct
- 1402 Alvin Ct
- 1351 Burnside Ct
- 1286 Highgate Ct
- 1091 Alta Vista Dr
- 675 Parlanti Ln Unit 18
- 675 Parlanti Ln Unit 33
- 675 Parlanti Ln Unit 38
- 675 Parlanti Ln Unit 11
- 675 Parlanti Ln Unit 127
- 675 Parlanti Ln Unit 63
- 1655 Sabatino Dr
- 860 Cherry Tree Dr Unit 2
- 1150 Brooktree Dr Unit 3
- 1292 O'Callaghan Dr
- 1236 Flora Glen Dr
- 950 Sage View Dr
- 1154 Harbour Cove Ct
- 828 Woodglen Dr Unit 2
- 909 Mesa Ridge Dr Unit 1
- 1285 Pullman Ct
- 1281 Pullman Ct
- 1341 Coupler Ct
- 1287 Pullman Ct
- 1337 Coupler Ct
- 1279 Pullman Ct
- 1349 Coupler Ct
- 1289 Pullman Ct
- 1291 Pullman Ct
- 1277 Pullman Ct
- 1293 Pullman Ct
- 1333 Coupler Ct
- 1353 Coupler Ct
- 1353 Coupler Ct Unit 5636
- 1275 Pullman Ct
- 1329 Coupler Ct
- 1309 Pullman Dr
- 1327 Coupler Way Unit 2
- 1313 Pullman Dr
- 1297 Pullman Ct
Your Personal Tour Guide
Ask me questions while you tour the home.