Estimated Value: $97,000 - $149,000
3
Beds
1
Bath
864
Sq Ft
$145/Sq Ft
Est. Value
About This Home
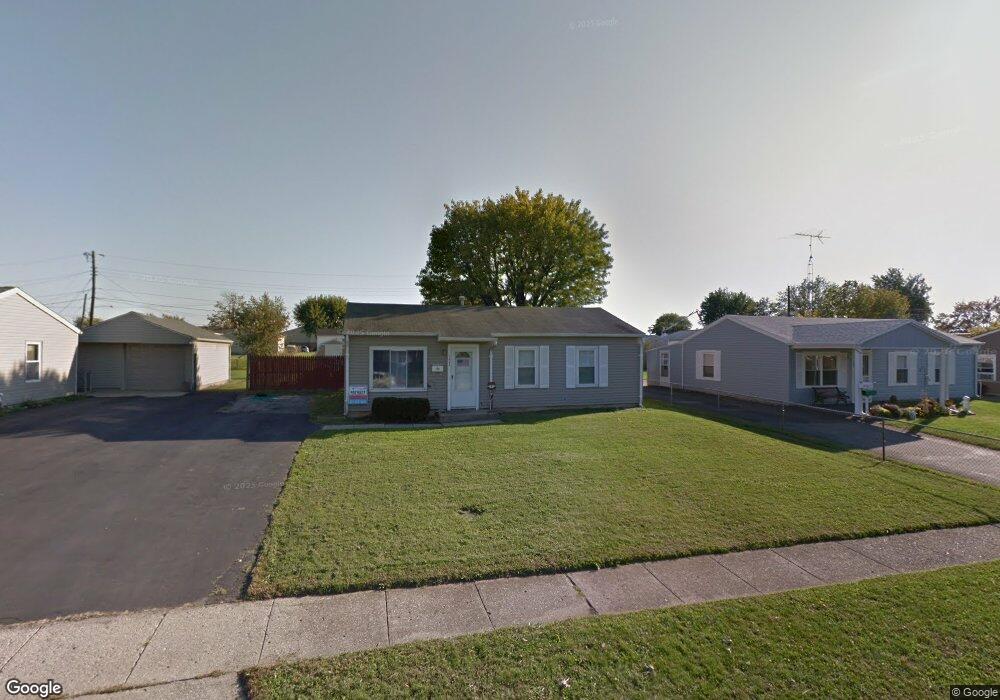
This home is located at 1283 Raybell Dr, Xenia, OH 45385 and is currently estimated at $124,876, approximately $144 per square foot. 1283 Raybell Dr is a home located in Greene County with nearby schools including Xenia High School, Summit Academy Community School for Alternative Learners - Xenia, and Legacy Christian Academy.
Ownership History
Date
Name
Owned For
Owner Type
Purchase Details
Closed on
Jun 6, 2019
Sold by
Brown Mark A and Brown Beth R
Bought by
Moore Aaron
Current Estimated Value
Purchase Details
Closed on
Nov 16, 2000
Sold by
Bankers Trust Company Of California Na
Bought by
Brown Mark A and Brown Beth R
Home Financials for this Owner
Home Financials are based on the most recent Mortgage that was taken out on this home.
Original Mortgage
$35,200
Interest Rate
11.95%
Purchase Details
Closed on
Aug 22, 2000
Sold by
Rice Baron E and Schmidt James W
Bought by
Bankers Trust Company Of California Na and Delta Funding Home Equity Loan Tr 1997-1
Purchase Details
Closed on
Aug 7, 2000
Sold by
Rice Baron E and Rice Trina A
Bought by
Bankers Trust Company Of California Na
Purchase Details
Closed on
Oct 19, 1995
Sold by
Rice Beth A
Bought by
Rice Baron E and Rice A
Home Financials for this Owner
Home Financials are based on the most recent Mortgage that was taken out on this home.
Original Mortgage
$43,212
Interest Rate
7.68%
Mortgage Type
New Conventional
Create a Home Valuation Report for This Property
The Home Valuation Report is an in-depth analysis detailing your home's value as well as a comparison with similar homes in the area
Home Values in the Area
Average Home Value in this Area
Purchase History
| Date | Buyer | Sale Price | Title Company |
|---|---|---|---|
| Moore Aaron | $53,500 | None Available | |
| Brown Mark A | $44,000 | -- | |
| Bankers Trust Company Of California Na | $42,000 | Precision Land Title Agency | |
| Bankers Trust Company Of California Na | $42,000 | -- | |
| Rice Baron E | $47,000 | -- |
Source: Public Records
Mortgage History
| Date | Status | Borrower | Loan Amount |
|---|---|---|---|
| Previous Owner | Brown Mark A | $35,200 | |
| Previous Owner | Rice Baron E | $43,212 |
Source: Public Records
Tax History Compared to Growth
Tax History
| Year | Tax Paid | Tax Assessment Tax Assessment Total Assessment is a certain percentage of the fair market value that is determined by local assessors to be the total taxable value of land and additions on the property. | Land | Improvement |
|---|---|---|---|---|
| 2024 | $1,108 | $30,570 | $10,290 | $20,280 |
| 2023 | $1,108 | $30,570 | $10,290 | $20,280 |
| 2022 | $1,076 | $21,440 | $7,350 | $14,090 |
| 2021 | $1,090 | $21,440 | $7,350 | $14,090 |
| 2020 | $1,044 | $21,440 | $7,350 | $14,090 |
| 2019 | $1,081 | $20,890 | $5,130 | $15,760 |
| 2018 | $1,085 | $20,890 | $5,130 | $15,760 |
| 2017 | $1,054 | $20,890 | $5,130 | $15,760 |
| 2016 | $1,043 | $19,700 | $5,130 | $14,570 |
| 2015 | $1,046 | $19,700 | $5,130 | $14,570 |
| 2014 | $1,001 | $19,700 | $5,130 | $14,570 |
Source: Public Records
Map
Nearby Homes
- 1342 Kylemore Dr
- 1223 June Dr
- 1233 June Dr
- 1283 June Dr
- 1391 June Dr
- 1144 Rockwell Dr
- 1208 Bellbrook Ave
- 343 Sheelin Rd
- 1272 Bellbrook Ave
- 1568 Cheyenne Dr
- 1351 Omard Dr
- 305-325 Bellbrook Ave
- 1618 Navajo Dr
- 121 S Progress Dr
- 883 Omard Dr
- 912 Omard Dr
- 453 Walnut St
- 509 Antrim Rd
- 1653 Seneca Dr
- 1778 Arapaho Dr
- 1267 Raybell Dr
- 1307 Raybell Dr
- 1276 W 2nd St
- 1319 Raybell Dr
- 1296 W 2nd St
- 1264 W 2nd St
- 1282 Raybell Dr
- 1294 Raybell Dr
- 1270 Raybell Dr
- 1310 W 2nd St
- 1306 Raybell Dr
- 273 Massie Dr
- 261 Massie Dr
- 1331 Raybell Dr
- 1322 W 2nd St
- 1318 Raybell Dr
- 249 Massie Dr
- 229 Massie Dr
- 1334 W 2nd St
- 1277 Kylemore Dr