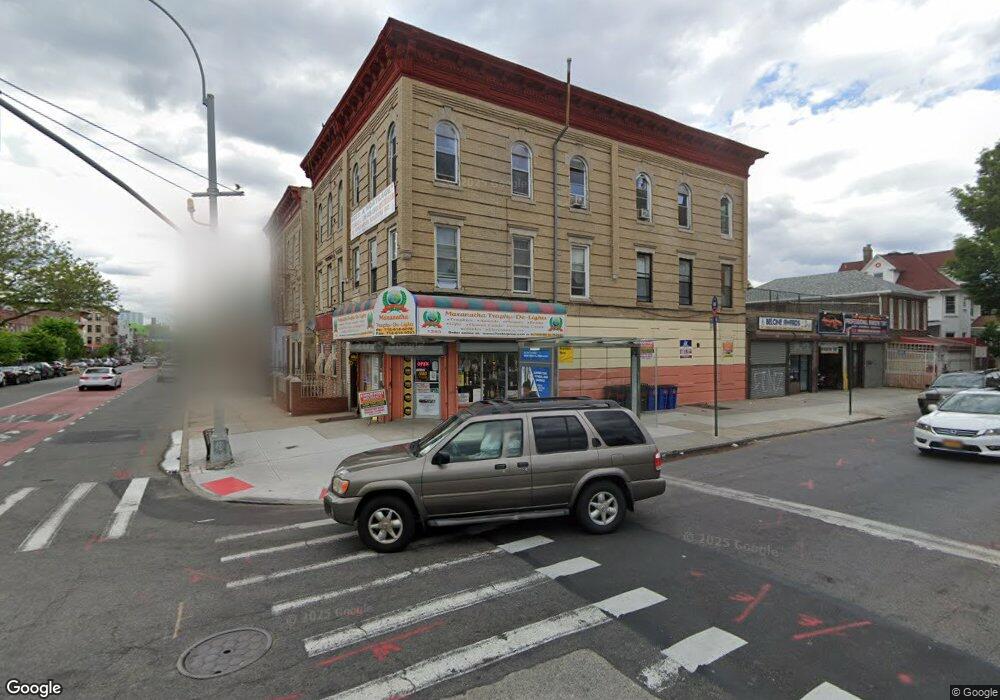
1283 Rogers Ave Unit 6 Brooklyn, NY 11226
Flatbush NeighborhoodEstimated Value: $1,912,500
Studio
--
Bath
5,350
Sq Ft
$357/Sq Ft
Est. Value
About This Home
This home is located at 1283 Rogers Ave Unit 6, Brooklyn, NY 11226 and is currently estimated at $1,912,500, approximately $357 per square foot. 1283 Rogers Ave Unit 6 is a home located in Kings County with nearby schools including J.H.S. 278 Marine Park, Central Brooklyn Ascend Charter, and Midwood Montessori.
Ownership History
Date
Name
Owned For
Owner Type
Purchase Details
Closed on
Sep 18, 2018
Sold by
1283 Rogers Llc
Bought by
1283 Rogers Street Llc
Current Estimated Value
Home Financials for this Owner
Home Financials are based on the most recent Mortgage that was taken out on this home.
Original Mortgage
$86,576
Outstanding Balance
$75,031
Interest Rate
4.5%
Mortgage Type
New Conventional
Estimated Equity
$1,837,469
Purchase Details
Closed on
Jan 5, 2016
Sold by
Xing Realty Corp
Bought by
1283 Rogers Llc
Purchase Details
Closed on
Dec 18, 2013
Sold by
Kaj Buildings Llc
Bought by
Xing Realty Corp
Home Financials for this Owner
Home Financials are based on the most recent Mortgage that was taken out on this home.
Original Mortgage
$550,000
Interest Rate
4.24%
Mortgage Type
Commercial
Create a Home Valuation Report for This Property
The Home Valuation Report is an in-depth analysis detailing your home's value as well as a comparison with similar homes in the area
Home Values in the Area
Average Home Value in this Area
Purchase History
| Date | Buyer | Sale Price | Title Company |
|---|---|---|---|
| 1283 Rogers Street Llc | $1,650,000 | -- | |
| 1283 Rogers Street Llc | $1,650,000 | -- | |
| 1283 Rogers Llc | $1,275,000 | -- | |
| 1283 Rogers Llc | $1,275,000 | -- | |
| Xing Realty Corp | $1,180,000 | -- | |
| Xing Realty Corp | $1,180,000 | -- |
Source: Public Records
Mortgage History
| Date | Status | Borrower | Loan Amount |
|---|---|---|---|
| Open | 1283 Rogers Street Llc | $86,576 | |
| Closed | 1283 Rogers Street Llc | $86,576 | |
| Previous Owner | Xing Realty Corp | $550,000 |
Source: Public Records
Tax History
| Year | Tax Paid | Tax Assessment Tax Assessment Total Assessment is a certain percentage of the fair market value that is determined by local assessors to be the total taxable value of land and additions on the property. | Land | Improvement |
|---|---|---|---|---|
| 2025 | $18,761 | $285,300 | $49,500 | $235,800 |
| 2024 | $18,761 | $293,220 | $49,500 | $243,720 |
| 2023 | $17,160 | $244,350 | $49,500 | $194,850 |
| 2022 | $15,962 | $250,650 | $49,500 | $201,150 |
| 2021 | $12,245 | $294,300 | $49,500 | $244,800 |
| 2020 | $7,518 | $294,300 | $49,500 | $244,800 |
| 2019 | $14,558 | $367,920 | $49,500 | $318,420 |
| 2018 | $13,686 | $107,604 | $11,582 | $96,022 |
| 2017 | $12,764 | $100,357 | $12,516 | $87,841 |
| 2016 | $12,938 | $100,357 | $13,799 | $86,558 |
| 2015 | $7,778 | $95,898 | $13,120 | $82,778 |
| 2014 | $7,778 | $88,795 | $14,578 | $74,217 |
Source: Public Records
Map
Nearby Homes
- 1273 Rogers Ave Unit MULTIFAM
- 1273 Rogers Ave
- 455 E 26th St
- 2701 Newkirk Ave Unit 3D
- 2701 Newkirk Ave Unit 3A
- 2701 Newkirk Ave Unit 7A
- 2701 Newkirk Ave Unit 3H
- 2701 Newkirk Ave Unit 7F
- 2701 Newkirk Ave Unit 2G
- 448 E 29th St
- 515 E 26th St
- 1316 Rogers Ave
- 1193 Rogers Ave
- 2913 Foster Ave Unit 1B
- 2913 Foster Ave Unit 2F
- 2913 Foster Ave Unit 3D
- 2913 Foster Ave Unit 6G
- 408 E 29th St
- 458 E 25th St Unit 504
- 458 E 25th St Unit 305
- 1283 Rogers Ave Unit 2 A
- 1283 Rogers Ave Unit 2 R
- 1283 Rogers Ave
- 1283 Rogers Ave Unit 2F
- 1267 Rogers Ave
- 2715 Foster Ave
- 1273 Rogers Ave Unit 9
- 1273 Rogers Ave Unit 3A
- 1273 Rogers Ave Unit 2LB
- 1271 Rogers Ave Unit 1
- 1271 Rogers Ave
- 1269 Rogers Ave
- 1269 Rogers Ave Unit 2
- 1285 Rogers Ave Unit Building
- 486 E 28th St
- 490 E 28th St
- 1265 Rogers Ave
- 476 E 28th St
- 1263 Rogers Ave
- 1295 Rogers Ave
Your Personal Tour Guide
Ask me questions while you tour the home.