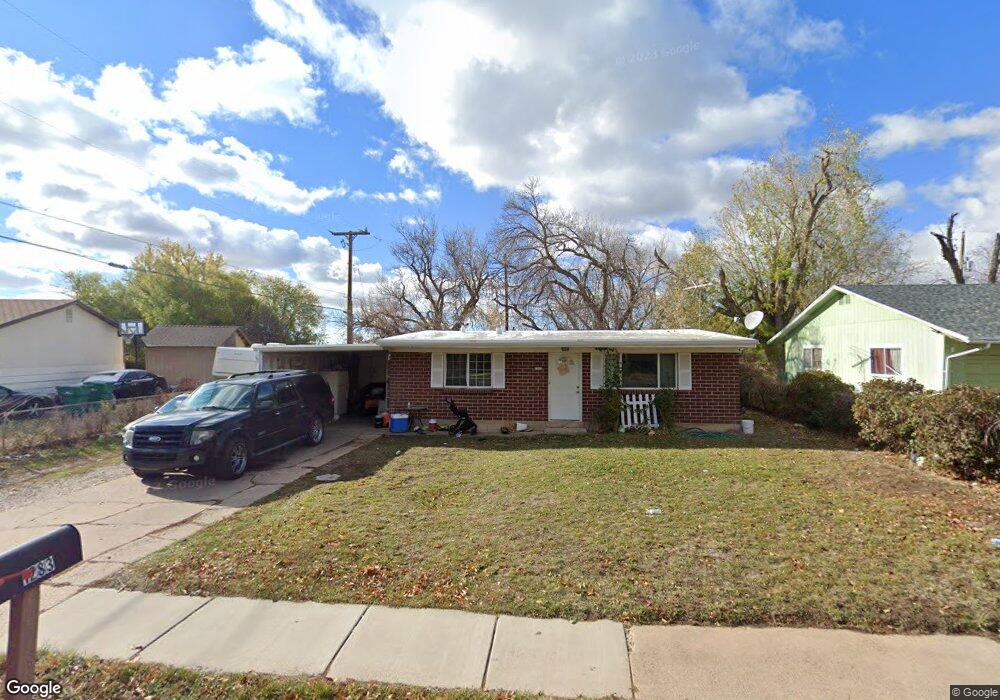
1283 Sherma Ave Layton, UT 84041
Estimated Value: $342,000 - $375,000
3
Beds
1
Bath
1,174
Sq Ft
$307/Sq Ft
Est. Value
About This Home
This home is located at 1283 Sherma Ave, Layton, UT 84041 and is currently estimated at $360,997, approximately $307 per square foot. 1283 Sherma Ave is a home located in Davis County with nearby schools including Vae View Elementary School, Central Davis Junior High School, and Layton High School.
Ownership History
Date
Name
Owned For
Owner Type
Purchase Details
Closed on
Dec 6, 2021
Sold by
Frazier Paul E
Bought by
Cazayla Llc
Current Estimated Value
Purchase Details
Closed on
Dec 18, 2012
Sold by
Greer Harvey S
Bought by
Frazier Paul E
Home Financials for this Owner
Home Financials are based on the most recent Mortgage that was taken out on this home.
Original Mortgage
$54,975
Interest Rate
2.66%
Mortgage Type
New Conventional
Purchase Details
Closed on
Jul 27, 2005
Sold by
Thompson Robert B
Bought by
Greer Harvey S
Home Financials for this Owner
Home Financials are based on the most recent Mortgage that was taken out on this home.
Original Mortgage
$82,100
Interest Rate
7.5%
Mortgage Type
Fannie Mae Freddie Mac
Purchase Details
Closed on
Dec 6, 2001
Sold by
Frazier Paul E
Bought by
Cazayla Llc
Purchase Details
Closed on
Aug 14, 2001
Sold by
Kelley Clarence L and Kelley Elois L
Bought by
Thompson Robert B
Home Financials for this Owner
Home Financials are based on the most recent Mortgage that was taken out on this home.
Original Mortgage
$70,000
Interest Rate
7%
Create a Home Valuation Report for This Property
The Home Valuation Report is an in-depth analysis detailing your home's value as well as a comparison with similar homes in the area
Home Values in the Area
Average Home Value in this Area
Purchase History
| Date | Buyer | Sale Price | Title Company |
|---|---|---|---|
| Cazayla Llc | -- | None Available | |
| Frazier Paul E | -- | First American Title Co Llc | |
| Greer Harvey S | -- | Equity Title Ins Agency Inc | |
| Cazayla Llc | -- | None Listed On Document | |
| Thompson Robert B | -- | Intermountain Title |
Source: Public Records
Mortgage History
| Date | Status | Borrower | Loan Amount |
|---|---|---|---|
| Previous Owner | Frazier Paul E | $54,975 | |
| Previous Owner | Greer Harvey S | $82,100 | |
| Previous Owner | Thompson Robert B | $70,000 |
Source: Public Records
Tax History Compared to Growth
Tax History
| Year | Tax Paid | Tax Assessment Tax Assessment Total Assessment is a certain percentage of the fair market value that is determined by local assessors to be the total taxable value of land and additions on the property. | Land | Improvement |
|---|---|---|---|---|
| 2025 | $1,614 | $169,400 | $103,254 | $66,146 |
| 2024 | $1,566 | $165,549 | $123,297 | $42,252 |
| 2023 | $1,518 | $155,650 | $88,569 | $67,080 |
| 2022 | $1,641 | $302,000 | $137,123 | $164,877 |
| 2021 | $1,477 | $223,000 | $107,154 | $115,846 |
| 2020 | $2,210 | $176,000 | $78,835 | $97,165 |
| 2019 | $1,213 | $172,000 | $75,806 | $96,194 |
| 2018 | $1,046 | $149,000 | $70,190 | $78,810 |
| 2016 | $893 | $65,615 | $20,192 | $45,423 |
| 2015 | $842 | $58,685 | $20,192 | $38,493 |
| 2014 | $920 | $65,604 | $20,192 | $45,412 |
| 2013 | -- | $63,978 | $20,680 | $43,298 |
Source: Public Records
Map
Nearby Homes
- 1523 Sherma Ave
- Fremont Plan at Trailside
- Blakely Plan at Trailside
- Arlington Plan at Trailside
- Savannah Plan at Trailside
- Charlotte Plan at Trailside
- Birmingham Plan at Trailside
- Oakridge Plan at Trailside
- Middleton Plan at Trailside
- Wilmington Plan at Trailside
- 1211 N 1875 W Unit 211
- 1211 N 1875 W
- 1219 N 1875 W
- 1219 N 1875 W Unit 212
- 1493 Marilyn Dr
- 1133 Laytona Dr
- 1456 Scott Cir
- 1591 N Marilyn Dr
- 979 Cold Creek Way
- 1451 N 1875 W Unit 168
- 1291 Sherma Ave
- 1286 N 1725 W
- 1303 Sherma Ave
- 2600 N Hill Rd Unit 41
- 2600 N Hill Rd Unit 12
- 2600 N Hill Rd Unit 105
- 2600 N Hill Rd
- 2600 N Hill Rd W Unit 85
- 257 E Fremont Way N
- 1400 S 2600
- 1600 E 1850 N
- 244 W Fremont Way N Unit 244
- 2600 N Hill Rd Unit 68
- 2600 N Hill Rd Unit 67
- 1647 Stanford St
- 1223 N 1640 W
- 1298 N 1725 W
- 1321 Sherma Ave
- 1637 Stanford St
- 1224 N 1640 W