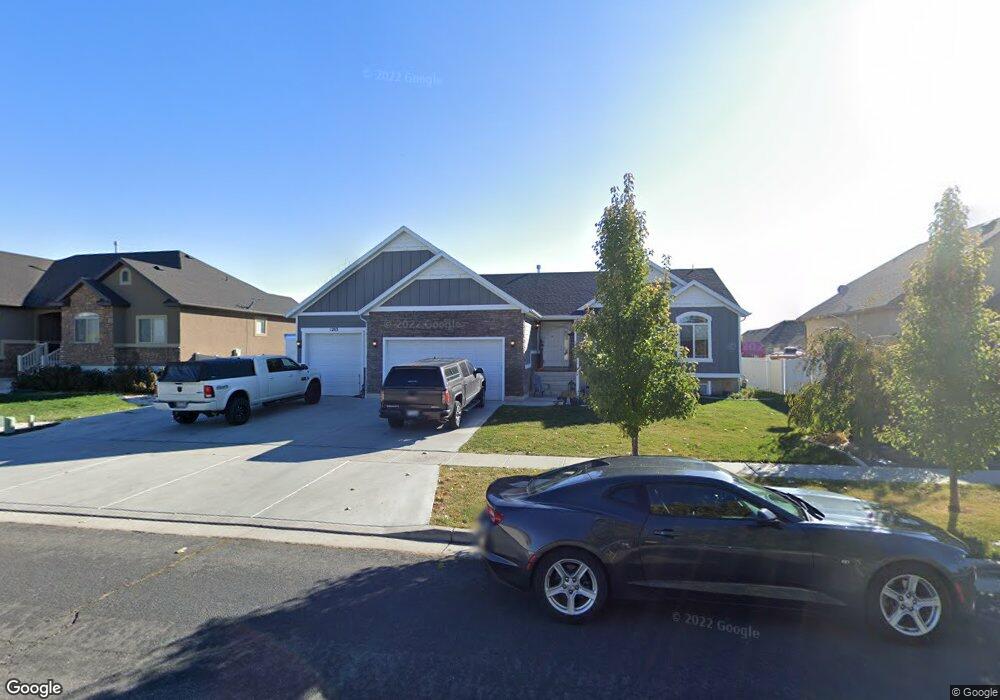
1283 W 3090 S Syracuse, UT 84075
Estimated Value: $611,000 - $672,000
5
Beds
3
Baths
1,598
Sq Ft
$404/Sq Ft
Est. Value
About This Home
This home is located at 1283 W 3090 S, Syracuse, UT 84075 and is currently estimated at $645,257, approximately $403 per square foot. 1283 W 3090 S is a home with nearby schools including Bluff Ridge Elementary, Legacy Junior High School, and Clearfield High School.
Ownership History
Date
Name
Owned For
Owner Type
Purchase Details
Closed on
Dec 9, 2019
Sold by
Sharpe Christian S
Bought by
Sharpe Christina S and Sharpe Amee A
Current Estimated Value
Home Financials for this Owner
Home Financials are based on the most recent Mortgage that was taken out on this home.
Original Mortgage
$366,300
Outstanding Balance
$322,378
Interest Rate
3.62%
Mortgage Type
FHA
Estimated Equity
$322,879
Purchase Details
Closed on
Oct 7, 2016
Sold by
Country West Construction & Real Est Inc
Bought by
Sharpe Christian S and Sharpe Amee A
Purchase Details
Closed on
Dec 31, 2015
Sold by
Acw Investments Lc
Bought by
West Construction & Real Est Inc
Purchase Details
Closed on
Nov 5, 2007
Sold by
Teton Investments Llc
Bought by
Acw Investments Lc
Purchase Details
Closed on
Dec 17, 2006
Sold by
Benchmark Real Estate Co
Bought by
Teton Investments Llc
Create a Home Valuation Report for This Property
The Home Valuation Report is an in-depth analysis detailing your home's value as well as a comparison with similar homes in the area
Home Values in the Area
Average Home Value in this Area
Purchase History
| Date | Buyer | Sale Price | Title Company |
|---|---|---|---|
| Sharpe Christina S | -- | Us Title Company | |
| Sharpe Christian S | -- | Us Title Company O | |
| Sharpe Christian S | -- | First American Title | |
| West Construction & Real Est Inc | -- | Stewart Title | |
| Acw Investments Lc | -- | None Available | |
| Teton Investments Llc | -- | Founders Title Co Layton |
Source: Public Records
Mortgage History
| Date | Status | Borrower | Loan Amount |
|---|---|---|---|
| Open | Sharpe Christian S | $366,300 |
Source: Public Records
Tax History Compared to Growth
Tax History
| Year | Tax Paid | Tax Assessment Tax Assessment Total Assessment is a certain percentage of the fair market value that is determined by local assessors to be the total taxable value of land and additions on the property. | Land | Improvement |
|---|---|---|---|---|
| 2025 | $3,654 | $352,550 | $123,707 | $228,843 |
| 2024 | $3,420 | $332,200 | $101,129 | $231,071 |
| 2023 | $3,283 | $581,000 | $140,978 | $440,022 |
| 2022 | $3,503 | $339,900 | $81,315 | $258,585 |
| 2021 | $3,109 | $467,000 | $120,031 | $346,969 |
| 2020 | $2,909 | $423,000 | $105,154 | $317,846 |
| 2019 | $2,863 | $411,000 | $102,057 | $308,943 |
| 2018 | $2,660 | $379,000 | $98,955 | $280,045 |
| 2016 | $925 | $69,105 | $69,105 | $0 |
| 2015 | $971 | $69,105 | $69,105 | $0 |
| 2014 | $953 | $69,105 | $69,105 | $0 |
| 2013 | -- | $59,220 | $59,220 | $0 |
Source: Public Records
Map
Nearby Homes
- 2958 S 1320 W
- 1139 W 3150 S
- 3074 S Edgewater Ln
- 2766 S 1200 W
- 967 W Yamada Ct
- 1701 W Ross Rd
- 1711 W Ross Rd
- 1694 2975 S Unit D
- 2983 S 1765 W
- 2744 S Allison Way Unit 211
- 2742 S Allison Way Unit 212
- 1713 W Parkview Dr
- 3637 S Creek Side Ln
- 1695 W 2770 S Unit 203
- 3528 S Finch St
- 3067 S Old Emigrant Rd Unit B
- 921 W 2700 S
- 1651 W White Pine Dr
- 1806 Park Dr
- 1137 W 2500 S
- 1299 W 3090 S Unit 304
- 1299 W 3090 S
- 1267 W 3090 S
- 1294 W 3150 S
- 1282 W 3150 S
- 3074 S 1265 W
- 1308 W 3150 S
- 1317 W 3090 S Unit 305
- 1249 Carlton Way
- 3077 S 1325 W
- 1324 W 3150 S
- 1121 1250 W Unit 104
- 1166 1250 W Unit 215
- 1143 1250 W Unit 103
- 1133 1250 W
- 1133 1250 W Unit 103
- 1147 1250 W Unit 102
- 1152 1250 W Unit 140
- 1153 1250 W Unit 101
- 1173 1250 W Unit 141