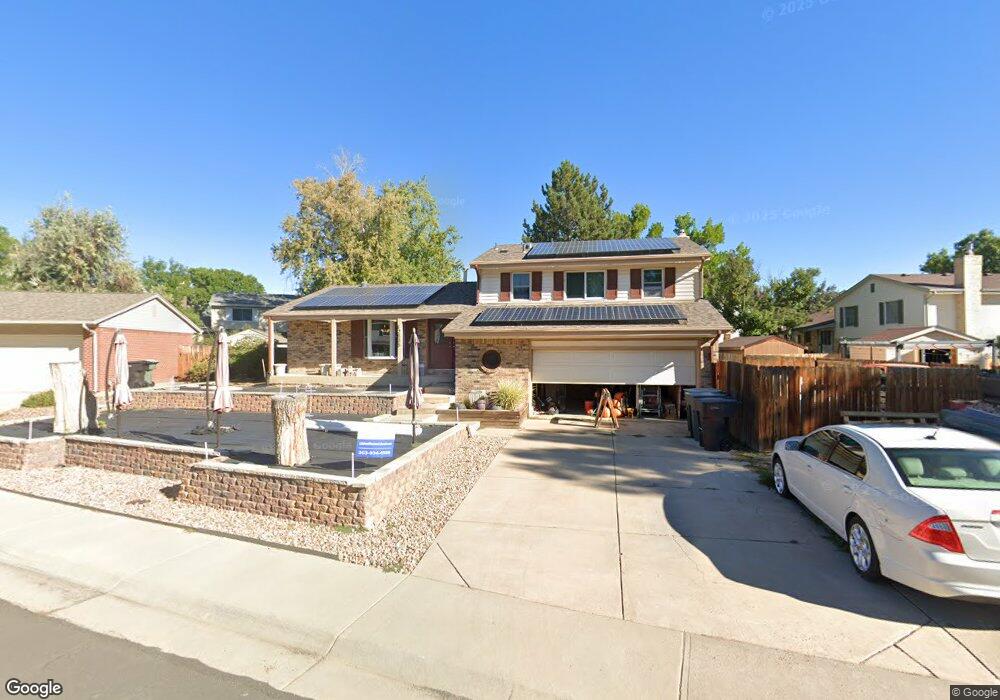
12835 Cook Dr Thornton, CO 80241
Estimated Value: $520,000 - $546,000
4
Beds
3
Baths
1,746
Sq Ft
$303/Sq Ft
Est. Value
About This Home
This home is located at 12835 Cook Dr, Thornton, CO 80241 and is currently estimated at $528,783, approximately $302 per square foot. 12835 Cook Dr is a home located in Adams County with nearby schools including Tarver Elementary School, Century Middle School, and Horizon High School.
Ownership History
Date
Name
Owned For
Owner Type
Purchase Details
Closed on
Mar 10, 2017
Sold by
Mcintosh Roger K
Bought by
Mcintosh Roger K and Mcintosh Margartgia
Current Estimated Value
Purchase Details
Closed on
Oct 11, 2006
Sold by
Smith Roger D and Smith Peggy June
Bought by
Mcintos Roger K
Home Financials for this Owner
Home Financials are based on the most recent Mortgage that was taken out on this home.
Original Mortgage
$249,900
Outstanding Balance
$148,708
Interest Rate
6.41%
Mortgage Type
Purchase Money Mortgage
Estimated Equity
$380,075
Purchase Details
Closed on
Jun 27, 1997
Sold by
Napoles Irma A
Bought by
Smith Roger D and Smith Peggy June
Purchase Details
Closed on
Apr 9, 1997
Sold by
Napoles John B
Bought by
Napoles Irma A
Purchase Details
Closed on
Oct 27, 1994
Sold by
Conklin Gordon J and Conklin Janet C
Bought by
Napoles John B and Napoles Irma A
Home Financials for this Owner
Home Financials are based on the most recent Mortgage that was taken out on this home.
Original Mortgage
$114,000
Interest Rate
8.62%
Create a Home Valuation Report for This Property
The Home Valuation Report is an in-depth analysis detailing your home's value as well as a comparison with similar homes in the area
Home Values in the Area
Average Home Value in this Area
Purchase History
| Date | Buyer | Sale Price | Title Company |
|---|---|---|---|
| Mcintosh Roger K | -- | First American Title | |
| Mcintos Roger K | $249,900 | Title America | |
| Smith Roger D | $148,900 | -- | |
| Napoles Irma A | -- | -- | |
| Napoles John B | $142,500 | Land Title |
Source: Public Records
Mortgage History
| Date | Status | Borrower | Loan Amount |
|---|---|---|---|
| Open | Mcintos Roger K | $249,900 | |
| Previous Owner | Napoles John B | $114,000 |
Source: Public Records
Tax History Compared to Growth
Tax History
| Year | Tax Paid | Tax Assessment Tax Assessment Total Assessment is a certain percentage of the fair market value that is determined by local assessors to be the total taxable value of land and additions on the property. | Land | Improvement |
|---|---|---|---|---|
| 2024 | $3,572 | $33,130 | $6,690 | $26,440 |
| 2023 | $3,535 | $38,220 | $6,490 | $31,730 |
| 2022 | $2,940 | $26,690 | $6,670 | $20,020 |
| 2021 | $3,038 | $26,690 | $6,670 | $20,020 |
| 2020 | $2,844 | $25,490 | $6,860 | $18,630 |
| 2019 | $2,849 | $25,490 | $6,860 | $18,630 |
| 2018 | $2,454 | $21,330 | $7,490 | $13,840 |
| 2017 | $2,232 | $21,330 | $7,490 | $13,840 |
| 2016 | $1,894 | $17,620 | $3,900 | $13,720 |
| 2015 | $1,891 | $17,620 | $3,900 | $13,720 |
| 2014 | -- | $16,430 | $3,180 | $13,250 |
Source: Public Records
Map
Nearby Homes
- 3007 E 131st Way
- 3802 E 127th Ln
- 12814 Jackson Cir
- 3850 E 128th Way
- 12672 Madison Ct
- 12625 Madison Way
- 12711 Colorado Blvd Unit 914
- 12711 Colorado Blvd Unit 617F
- 12627 Madison Way
- 2691 E 132nd Ave
- 12604 Madison Way
- 13080 Harrison Dr
- 13068 Harrison Dr
- 2788 E 132nd Cir
- 2746 E 132nd Place
- 12424 Madison Way
- 3225 E 124th Ave
- 2552 E 126th Way
- 13022 Bellaire St
- 12811 Josephine Ct