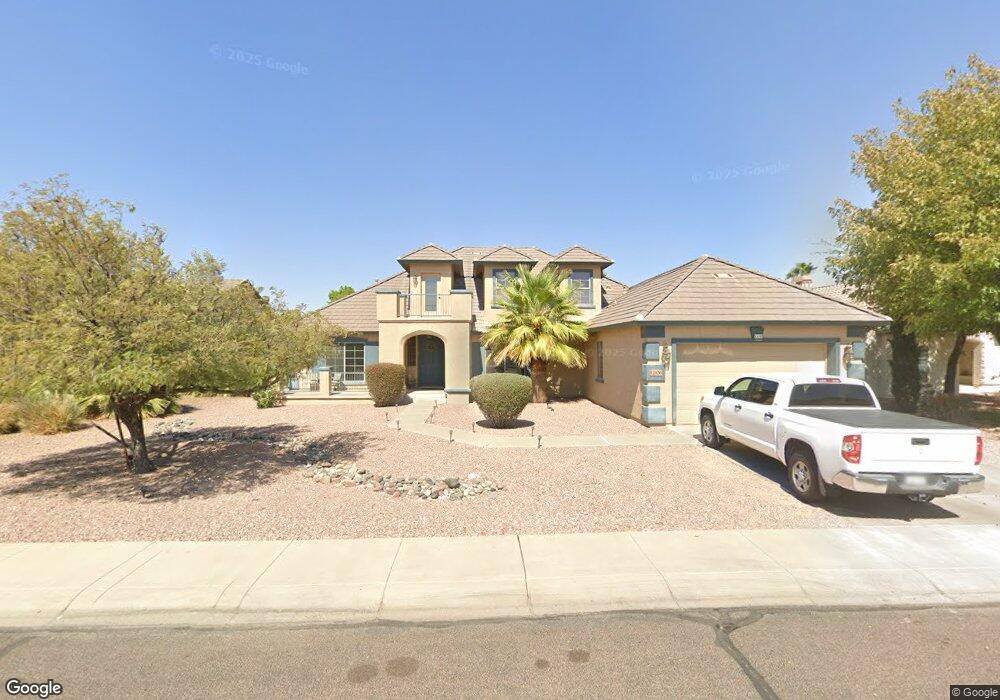
12836 W Colter St Litchfield Park, AZ 85340
Estimated Value: $701,000 - $920,000
6
Beds
4
Baths
4,141
Sq Ft
$194/Sq Ft
Est. Value
About This Home
This home is located at 12836 W Colter St, Litchfield Park, AZ 85340 and is currently estimated at $804,281, approximately $194 per square foot. 12836 W Colter St is a home located in Maricopa County with nearby schools including Barbara B. Robey Elementary School, L. Thomas Heck Middle School, and Trinity Lutheran School.
Ownership History
Date
Name
Owned For
Owner Type
Purchase Details
Closed on
Feb 29, 2008
Sold by
Kane Nelda Jean
Bought by
Kane Shawn
Current Estimated Value
Home Financials for this Owner
Home Financials are based on the most recent Mortgage that was taken out on this home.
Original Mortgage
$394,796
Outstanding Balance
$244,762
Interest Rate
5.65%
Mortgage Type
Purchase Money Mortgage
Estimated Equity
$559,519
Purchase Details
Closed on
May 29, 2007
Sold by
Vo John V
Bought by
Wells Fargo Bank Na
Purchase Details
Closed on
Jan 30, 2006
Sold by
Becker Homes Llc
Bought by
Vo John
Home Financials for this Owner
Home Financials are based on the most recent Mortgage that was taken out on this home.
Original Mortgage
$594,000
Interest Rate
8.95%
Mortgage Type
Purchase Money Mortgage
Create a Home Valuation Report for This Property
The Home Valuation Report is an in-depth analysis detailing your home's value as well as a comparison with similar homes in the area
Home Values in the Area
Average Home Value in this Area
Purchase History
| Date | Buyer | Sale Price | Title Company |
|---|---|---|---|
| Kane Shawn | -- | Chicago Title | |
| Kane Shawn | $415,575 | Chicago Title | |
| Wells Fargo Bank Na | $509,355 | None Available | |
| Vo John | $662,434 | First American Title Ins Co | |
| Becker Homes Llc | -- | First American Title Ins Co |
Source: Public Records
Mortgage History
| Date | Status | Borrower | Loan Amount |
|---|---|---|---|
| Open | Kane Shawn | $394,796 | |
| Closed | Kane Shawn | $394,796 | |
| Previous Owner | Vo John | $594,000 |
Source: Public Records
Tax History Compared to Growth
Tax History
| Year | Tax Paid | Tax Assessment Tax Assessment Total Assessment is a certain percentage of the fair market value that is determined by local assessors to be the total taxable value of land and additions on the property. | Land | Improvement |
|---|---|---|---|---|
| 2025 | $3,667 | $42,433 | -- | -- |
| 2024 | $3,485 | $40,413 | -- | -- |
| 2023 | $3,485 | $54,470 | $10,890 | $43,580 |
| 2022 | $3,294 | $42,270 | $8,450 | $33,820 |
| 2021 | $3,584 | $39,710 | $7,940 | $31,770 |
| 2020 | $3,394 | $38,730 | $7,740 | $30,990 |
| 2019 | $3,338 | $38,530 | $7,700 | $30,830 |
| 2018 | $3,146 | $37,870 | $7,570 | $30,300 |
| 2017 | $2,998 | $34,020 | $6,800 | $27,220 |
| 2016 | $2,845 | $30,850 | $6,170 | $24,680 |
| 2015 | $2,636 | $29,460 | $5,890 | $23,570 |
Source: Public Records
Map
Nearby Homes
- 12805 W Colter St
- 12866 W Orange Dr
- 12804 W Georgia Ave
- 12721 W Georgia Ave
- 12714 W Colter St
- 12803 W Missouri Ave
- 12918 W San Juan Ave
- 5312 N Sierra Hermosa Ct
- 5502 N Ormondo Way
- 5374 N Ormondo Way
- 5201 N 125th Ave
- 123XX W Estero Ln Unit 9
- 12428 W Vermont Ct
- 12952 W Vista Paseo Dr
- 12408 W Orange Dr
- 13305 W Colter St
- 5322 N Oro Vista Ct
- 13042 W Vista Paseo Dr
- 13118 W San Miguel Ave
- 1153 N Oro Vista
- 12830 W Colter St
- 12842 W Colter St
- 12824 W Colter St
- 12848 W Colter St
- 12837 W Colter St
- 12829 W Colter St
- 12847 W Colter St
- 12856 W Colter St
- 12816 W Colter St
- 12821 W Colter St
- 12855 W Colter St
- 3606 N 129th Ave
- 12838 W Orange Dr
- 12830 W Orange Dr
- 12819 W Georgia Ave
- 12813 W Georgia Ave
- 12808 W Colter St
- 12848 W Orange Dr
- 12811 W Colter St
- 12864 W Colter St