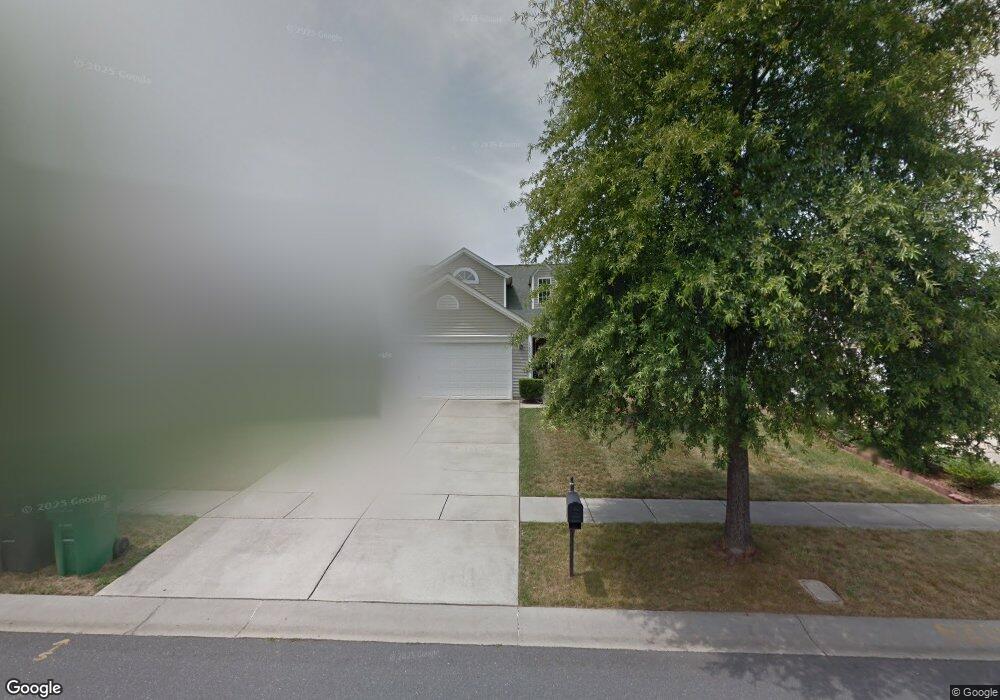
12839 Planters Row Dr Charlotte, NC 28278
Steele Creek NeighborhoodEstimated Value: $333,000 - $365,000
3
Beds
3
Baths
1,594
Sq Ft
$221/Sq Ft
Est. Value
About This Home
This home is located at 12839 Planters Row Dr, Charlotte, NC 28278 and is currently estimated at $352,273, approximately $220 per square foot. 12839 Planters Row Dr is a home located in Mecklenburg County with nearby schools including Winget Park Elementary, Southwest Middle School, and Unity Classical Charter School.
Ownership History
Date
Name
Owned For
Owner Type
Purchase Details
Closed on
Jul 15, 2021
Sold by
Fkh Sfr C2 Lp
Bought by
Fkh Sfr C2 Lp
Current Estimated Value
Purchase Details
Closed on
Dec 11, 2020
Sold by
Opendoor Property Trust I
Bought by
Cerberus Sfr Holdings V Lp
Purchase Details
Closed on
Nov 18, 2020
Sold by
Gaffney David S and Gaffney Theresa M
Bought by
Opendoor Peroprty Trust I
Purchase Details
Closed on
Mar 24, 2003
Sold by
Gaffney David S and Gaffney Theresa M
Bought by
Gaffney David S and Gaffney Theresa M
Home Financials for this Owner
Home Financials are based on the most recent Mortgage that was taken out on this home.
Original Mortgage
$130,000
Interest Rate
5.82%
Mortgage Type
FHA
Purchase Details
Closed on
Mar 20, 2001
Sold by
Mulvaney Homes Inc
Bought by
Gaffney David S
Home Financials for this Owner
Home Financials are based on the most recent Mortgage that was taken out on this home.
Original Mortgage
$131,200
Interest Rate
7.02%
Mortgage Type
FHA
Create a Home Valuation Report for This Property
The Home Valuation Report is an in-depth analysis detailing your home's value as well as a comparison with similar homes in the area
Home Values in the Area
Average Home Value in this Area
Purchase History
| Date | Buyer | Sale Price | Title Company |
|---|---|---|---|
| Fkh Sfr C2 Lp | -- | Os National Llc | |
| Cerberus Sfr Holdings V Lp | $257,000 | Investors Title Insurance Co | |
| Opendoor Peroprty Trust I | $253,000 | Chicago Title Insurance Co | |
| Gaffney David S | -- | -- | |
| Gaffney David S | $133,000 | -- |
Source: Public Records
Mortgage History
| Date | Status | Borrower | Loan Amount |
|---|---|---|---|
| Previous Owner | Gaffney David S | $130,000 | |
| Previous Owner | Gaffney David S | $131,200 |
Source: Public Records
Tax History Compared to Growth
Tax History
| Year | Tax Paid | Tax Assessment Tax Assessment Total Assessment is a certain percentage of the fair market value that is determined by local assessors to be the total taxable value of land and additions on the property. | Land | Improvement |
|---|---|---|---|---|
| 2025 | $2,767 | $345,200 | $80,000 | $265,200 |
| 2024 | $2,767 | $345,200 | $80,000 | $265,200 |
| 2023 | $2,671 | $345,200 | $80,000 | $265,200 |
| 2022 | $2,045 | $198,900 | $45,000 | $153,900 |
| 2021 | $2,034 | $198,900 | $45,000 | $153,900 |
| 2020 | $2,027 | $198,900 | $45,000 | $153,900 |
| 2019 | $2,011 | $198,900 | $45,000 | $153,900 |
| 2018 | $1,803 | $131,800 | $33,300 | $98,500 |
| 2017 | $1,769 | $131,800 | $33,300 | $98,500 |
| 2016 | $1,760 | $131,800 | $33,300 | $98,500 |
| 2015 | $1,748 | $131,800 | $33,300 | $98,500 |
| 2014 | $1,755 | $131,800 | $33,300 | $98,500 |
Source: Public Records
Map
Nearby Homes
- 10549 Glory Meadow Ct
- 10202 Orchard Grass Ct
- 13716 Sunrise View Dr Unit 55
- 13409 Planters Row Dr
- 10026 Orchard Grass Ct
- 3915 Planters Watch Dr
- 12824 Harvest Time Ct
- 14514 Arbor Ridge Dr
- 12609 Cedar Crossings Dr
- 11719 Withers Mill Dr
- 13001 Greycrest Dr
- 14311 Arbor Ridge Dr
- 10759 Big Bear Dr
- 14101 Arbor Ridge Dr
- 15137 Callow Forest Dr
- 3103 Middle St Unit 92
- 7021 W Row Ave
- 12113 Avienmore Dr
- 3119 Middle St Unit 94
- 12124 Avienmore Dr
- 12835 Planters Row Dr
- 12843 Planters Row Dr
- 12831 Planters Row Dr
- 12847 Planters Row Dr
- 12825 Planters Row Dr
- 12851 Planters Row Dr
- 12840 Planters Row Dr
- 12836 Planters Row Dr
- 12844 Planters Row Dr
- 12828 Planters Row Dr
- 12848 Planters Row Dr
- 12824 Planters Row Dr
- 12235 Creek Turn Dr
- 12852 Planters Row Dr
- 12247 Creek Turn Dr
- 12231 Creek Turn Dr
- 12241 Creek Turn Dr
- 12227 Creek Turn Dr
- 12905 Planters Row Dr
- 12816 Planters Row Dr