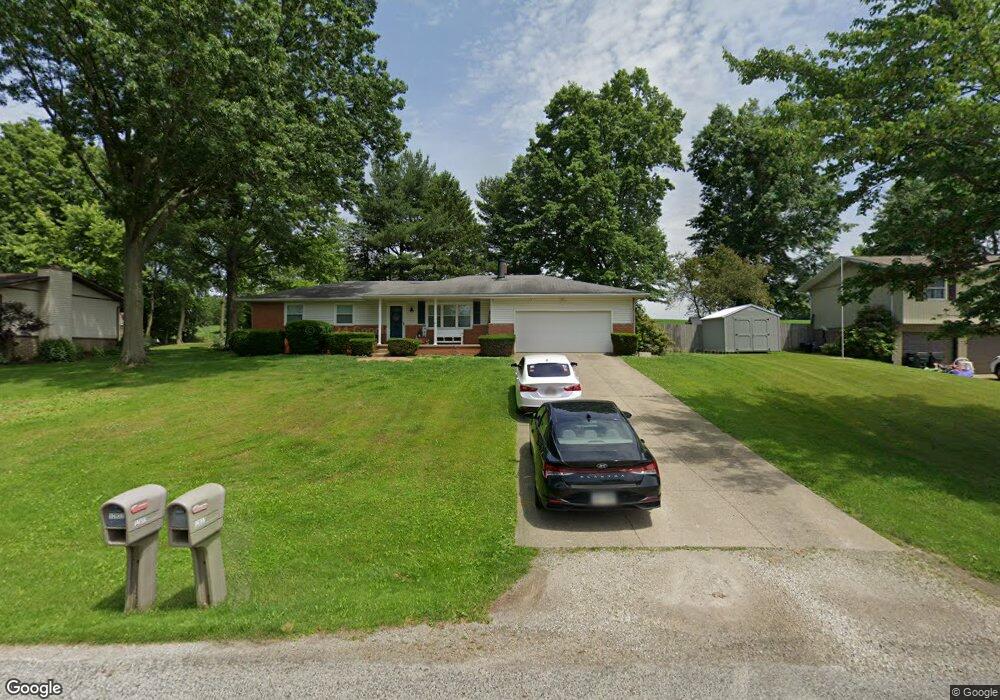
12841 Mark Path Doylestown, OH 44230
Estimated Value: $245,136 - $285,000
3
Beds
2
Baths
1,008
Sq Ft
$255/Sq Ft
Est. Value
About This Home
This home is located at 12841 Mark Path, Doylestown, OH 44230 and is currently estimated at $256,784, approximately $254 per square foot. 12841 Mark Path is a home located in Wayne County with nearby schools including Hazel Harvey Elementary School, Chippewa Intermediate School, and Chippewa Jr./Sr. High School.
Ownership History
Date
Name
Owned For
Owner Type
Purchase Details
Closed on
Jan 12, 2022
Sold by
Mcnelly Vincent T
Bought by
Mcnelly Vincent T and Hart Nichole
Current Estimated Value
Home Financials for this Owner
Home Financials are based on the most recent Mortgage that was taken out on this home.
Original Mortgage
$150,590
Outstanding Balance
$126,665
Interest Rate
3.22%
Mortgage Type
FHA
Estimated Equity
$130,119
Purchase Details
Closed on
Jul 12, 2019
Sold by
Hammond Ellen J
Bought by
Mcnelly Vincent T
Home Financials for this Owner
Home Financials are based on the most recent Mortgage that was taken out on this home.
Original Mortgage
$143,560
Interest Rate
3.9%
Mortgage Type
New Conventional
Purchase Details
Closed on
Dec 28, 1989
Sold by
Beers John M and Beers Carole J
Bought by
Ellis Ellen J
Purchase Details
Closed on
Dec 2, 1988
Sold by
Eakin David G and Eakin Steven J
Bought by
Beers John M and Beers Carole J
Create a Home Valuation Report for This Property
The Home Valuation Report is an in-depth analysis detailing your home's value as well as a comparison with similar homes in the area
Home Values in the Area
Average Home Value in this Area
Purchase History
| Date | Buyer | Sale Price | Title Company |
|---|---|---|---|
| Mcnelly Vincent T | $75,295 | Pearl Law Offices Llc | |
| Mcnelly Vincent T | $148,000 | Blueridge Title Agency | |
| Ellis Ellen J | $64,000 | -- | |
| Beers John M | $59,000 | -- |
Source: Public Records
Mortgage History
| Date | Status | Borrower | Loan Amount |
|---|---|---|---|
| Open | Mcnelly Vincent T | $150,590 | |
| Previous Owner | Mcnelly Vincent T | $143,560 |
Source: Public Records
Tax History
| Year | Tax Paid | Tax Assessment Tax Assessment Total Assessment is a certain percentage of the fair market value that is determined by local assessors to be the total taxable value of land and additions on the property. | Land | Improvement |
|---|---|---|---|---|
| 2025 | $2,379 | $68,820 | $20,380 | $48,440 |
| 2024 | $2,379 | $68,820 | $20,380 | $48,440 |
| 2023 | $2,391 | $68,820 | $20,380 | $48,440 |
| 2022 | $1,897 | $50,240 | $14,880 | $35,360 |
| 2021 | $1,911 | $50,240 | $14,880 | $35,360 |
| 2020 | $1,925 | $50,240 | $14,880 | $35,360 |
| 2019 | $1,413 | $44,280 | $12,010 | $32,270 |
| 2018 | $1,427 | $44,280 | $12,010 | $32,270 |
| 2017 | $1,415 | $44,280 | $12,010 | $32,270 |
| 2016 | $1,366 | $42,580 | $11,550 | $31,030 |
| 2015 | $1,708 | $42,580 | $11,550 | $31,030 |
| 2014 | $1,499 | $42,580 | $11,550 | $31,030 |
| 2013 | $1,515 | $41,730 | $11,660 | $30,070 |
Source: Public Records
Map
Nearby Homes
- 12214 Vince Dr
- 18592 Edwards Rd Unit 137
- 18592 Edwards Rd Unit 3
- 100 Merlot Ct
- 204 Circle Dr
- 14740 Oak Grove Dr Unit 41
- 580 Thorn Way
- 12045 Coal Bank Rd
- 680 Thorn Way
- 620 Thorn Way
- 15899 Mccallum Dr
- VL 1067 Homan Dr
- 0 S Portage St
- 14831 Calaboone Rd
- 6300 S Cleveland Massillon Rd
- V/L 1050 Melanie Ln
- 233 Homan Dr
- 16441 Bieri Rd
- 497 Gates St
- 0 Akron Rd Unit 5123781
- 12851 Mark Path
- 12837 Mark Path
- 12832 Mark Path
- 12865 Mark Path
- 12821 Mark Path
- 12862 Mark Path
- 12879 Mark Path
- 12840 Mark Path
- 12876 Mark Path
- 12808 Mark Path
- 12893 Mark Path
- 12890 Mark Path
- 12793 Mark Path
- 12788 Mark Path
- 0 Mark Path
- 12740 Mark Path
- 12900 Mark Path
- 12909 Mark Path
- 12845 Hametown Rd
- 12857 Hametown Rd
Your Personal Tour Guide
Ask me questions while you tour the home.