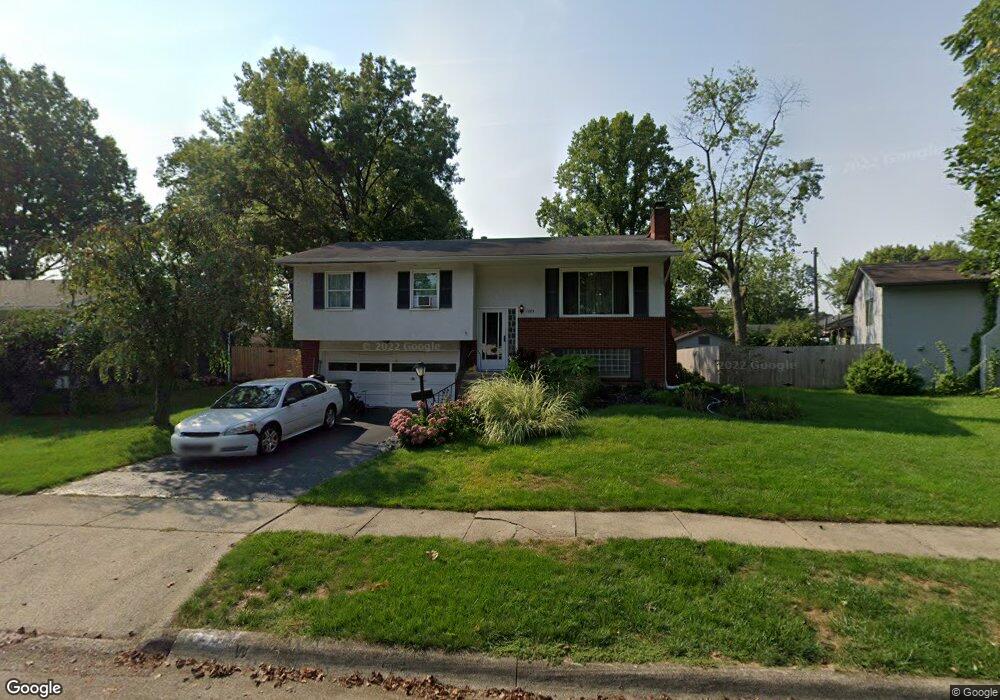
1285 Bosworth Square N Columbus, OH 43229
Devonshire NeighborhoodEstimated Value: $261,831 - $285,000
3
Beds
2
Baths
1,520
Sq Ft
$181/Sq Ft
Est. Value
About This Home
This home is located at 1285 Bosworth Square N, Columbus, OH 43229 and is currently estimated at $274,958, approximately $180 per square foot. 1285 Bosworth Square N is a home located in Franklin County with nearby schools including Devonshire Alternative Elementary School, Woodward Park Middle School, and Beechcroft High School.
Ownership History
Date
Name
Owned For
Owner Type
Purchase Details
Closed on
May 14, 2004
Sold by
Fox Kevin S and Fox Barbara
Bought by
Taylor John M
Current Estimated Value
Home Financials for this Owner
Home Financials are based on the most recent Mortgage that was taken out on this home.
Original Mortgage
$132,000
Outstanding Balance
$67,865
Interest Rate
6.89%
Mortgage Type
Purchase Money Mortgage
Estimated Equity
$207,093
Purchase Details
Closed on
Jun 30, 1998
Sold by
Plott Terry M
Bought by
Fox Kevin S and Fox Barbara
Purchase Details
Closed on
Apr 3, 1995
Sold by
Harms Lawrence G
Bought by
Terry M Plott
Home Financials for this Owner
Home Financials are based on the most recent Mortgage that was taken out on this home.
Original Mortgage
$85,992
Interest Rate
8.91%
Mortgage Type
FHA
Purchase Details
Closed on
Oct 19, 1989
Create a Home Valuation Report for This Property
The Home Valuation Report is an in-depth analysis detailing your home's value as well as a comparison with similar homes in the area
Home Values in the Area
Average Home Value in this Area
Purchase History
| Date | Buyer | Sale Price | Title Company |
|---|---|---|---|
| Taylor John M | $132,000 | -- | |
| Fox Kevin S | $99,900 | Chicago Title West | |
| Terry M Plott | $88,010 | -- | |
| -- | $72,800 | -- |
Source: Public Records
Mortgage History
| Date | Status | Borrower | Loan Amount |
|---|---|---|---|
| Open | Taylor John M | $132,000 | |
| Previous Owner | Terry M Plott | $85,992 |
Source: Public Records
Tax History Compared to Growth
Tax History
| Year | Tax Paid | Tax Assessment Tax Assessment Total Assessment is a certain percentage of the fair market value that is determined by local assessors to be the total taxable value of land and additions on the property. | Land | Improvement |
|---|---|---|---|---|
| 2024 | $3,591 | $80,010 | $17,850 | $62,160 |
| 2023 | $3,545 | $80,010 | $17,850 | $62,160 |
| 2022 | $2,679 | $51,660 | $13,650 | $38,010 |
| 2021 | $3,408 | $51,660 | $13,650 | $38,010 |
| 2020 | $3,037 | $51,660 | $13,650 | $38,010 |
| 2019 | $2,504 | $41,270 | $10,920 | $30,350 |
| 2018 | $2,333 | $41,270 | $10,920 | $30,350 |
| 2017 | $2,502 | $41,270 | $10,920 | $30,350 |
| 2016 | $2,389 | $36,060 | $8,300 | $27,760 |
| 2015 | $2,168 | $36,060 | $8,300 | $27,760 |
| 2014 | $2,174 | $36,060 | $8,300 | $27,760 |
| 2013 | $1,191 | $40,040 | $9,205 | $30,835 |
Source: Public Records
Map
Nearby Homes
- 1294 Clydesdale Ct
- 1409 Bosworth Place
- 1322 Bolenhill Ct
- 1421 Bosworth Place
- 1268 Kildale Ct
- 6407 Faircrest Rd
- 6458 Faircrest Rd
- 1635 Tendril Ct
- 1288 Oakfield Dr N
- 6342 Bellmeadow Dr
- 6189 Northgap Dr
- 6211 Parkdale Dr
- 1549 Alpine Dr
- 6407 Skywae Dr
- 1171 Newbury Dr
- 1755 Hillandale Ave
- 6035 Karl Rd
- 5990 Ambleside Dr
- 6355 Johnanne St
- 6496 Hearthstone Ave
- 1293 Bosworth Square N
- 6590 Bosworth Square W
- 1288 Bosworth Square S
- 1280 Bosworth Square S
- 1301 Bosworth Square N
- 1296 Bosworth Square S
- 1272 Bosworth Square S
- 1282 Bosworth Square N
- 1290 Bosworth Square N
- 1304 Bosworth Square S
- 1298 Bosworth Square N
- 1313 Bosworth Square N
- 1274 Bosworth Square N
- 1306 Bosworth Square N
- 6599 Bosworth Square W
- 6593 Bosworth Square W
- 6603 Bosworth Square W
- 1312 Bosworth Square S
- 6585 Bosworth Square W
- 1321 Bosworth Square N