1285 Caywood Rd Marietta, OH 45750
Estimated Value: $128,000 - $155,000
3
Beds
1
Bath
1,884
Sq Ft
$77/Sq Ft
Est. Value
About This Home
This home is located at 1285 Caywood Rd, Marietta, OH 45750 and is currently estimated at $145,580, approximately $77 per square foot. 1285 Caywood Rd is a home located in Washington County with nearby schools including Marietta High School, Wood County Christian School, and Marietta Christian School.
Ownership History
Date
Name
Owned For
Owner Type
Purchase Details
Closed on
Jun 20, 2008
Sold by
Sargent Christopher Chad
Bought by
Sargent Leigh Ann
Current Estimated Value
Home Financials for this Owner
Home Financials are based on the most recent Mortgage that was taken out on this home.
Original Mortgage
$75,000
Outstanding Balance
$48,004
Interest Rate
6%
Mortgage Type
Purchase Money Mortgage
Estimated Equity
$97,576
Purchase Details
Closed on
Jul 29, 2005
Sold by
Miller Amber D
Bought by
Sargent Christopher Chad and Sargent Leigh Ann
Home Financials for this Owner
Home Financials are based on the most recent Mortgage that was taken out on this home.
Original Mortgage
$49,950
Interest Rate
5.74%
Mortgage Type
New Conventional
Purchase Details
Closed on
Oct 22, 1992
Bought by
Secretary Of Veterans Af
Purchase Details
Closed on
Jan 15, 1992
Bought by
Sauls Charles J and Sauls Julian
Purchase Details
Closed on
Jun 7, 1991
Bought by
Miller Lloyd H
Create a Home Valuation Report for This Property
The Home Valuation Report is an in-depth analysis detailing your home's value as well as a comparison with similar homes in the area
Home Values in the Area
Average Home Value in this Area
Purchase History
| Date | Buyer | Sale Price | Title Company |
|---|---|---|---|
| Sargent Leigh Ann | -- | Attorney | |
| Sargent Christopher Chad | $53,333 | None Available | |
| Secretary Of Veterans Af | -- | -- | |
| Sauls Charles J | -- | -- | |
| Miller Lloyd H | -- | -- |
Source: Public Records
Mortgage History
| Date | Status | Borrower | Loan Amount |
|---|---|---|---|
| Open | Sargent Leigh Ann | $75,000 | |
| Previous Owner | Sargent Christopher Chad | $49,950 |
Source: Public Records
Tax History Compared to Growth
Tax History
| Year | Tax Paid | Tax Assessment Tax Assessment Total Assessment is a certain percentage of the fair market value that is determined by local assessors to be the total taxable value of land and additions on the property. | Land | Improvement |
|---|---|---|---|---|
| 2024 | $928 | $25,230 | $3,620 | $21,610 |
| 2023 | $928 | $25,230 | $3,620 | $21,610 |
| 2022 | $919 | $25,230 | $3,620 | $21,610 |
| 2021 | $937 | $24,450 | $3,320 | $21,130 |
| 2020 | $942 | $24,450 | $3,320 | $21,130 |
| 2019 | $940 | $24,450 | $3,320 | $21,130 |
| 2018 | $878 | $22,090 | $2,890 | $19,200 |
| 2017 | $869 | $22,090 | $2,890 | $19,200 |
| 2016 | $1,506 | $22,090 | $2,890 | $19,200 |
| 2015 | $815 | $19,970 | $2,640 | $17,330 |
| 2014 | $1,363 | $19,970 | $2,640 | $17,330 |
| 2013 | $406 | $19,970 | $2,640 | $17,330 |
Source: Public Records
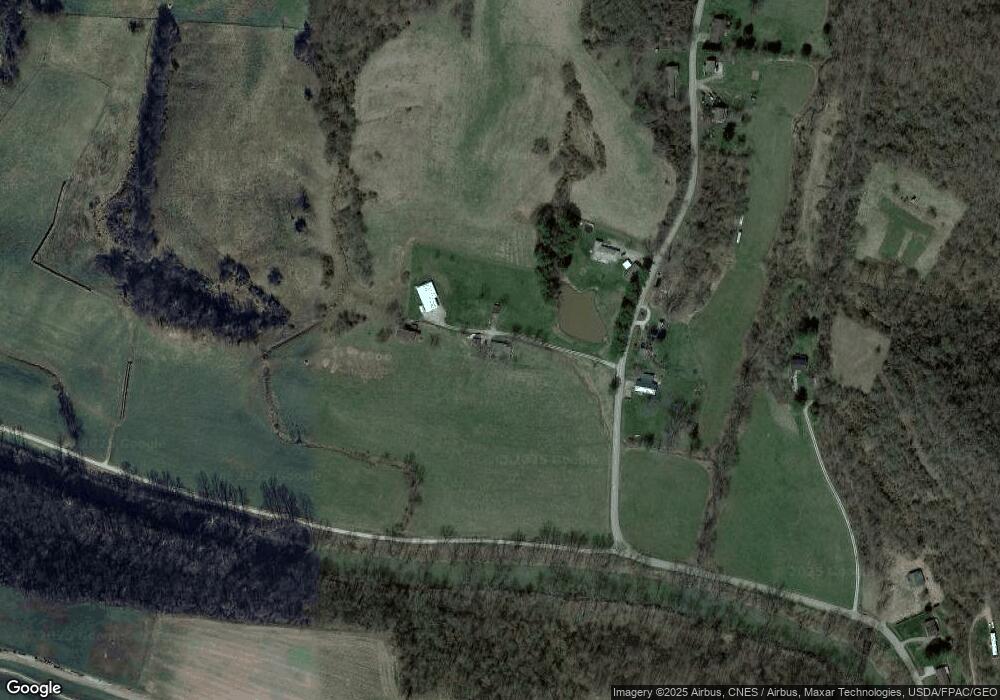
Map
Nearby Homes
- 1320 Caywood Rd
- 0 Ohio 26 Unit LotWP001 23010810
- 3205 Ohio 26
- 0 0 State Route 26 Rear Oh
- 0 Mountain Laurel Dr
- 8 Mountain Laurel Dr
- 6 Mountain Laurel Dr
- 5 Mountain Laurel Dr
- 3 Mountain Laurel Dr
- 107 Country Meadow Dr
- 120 Meadow Ln
- 3740 Ohio 26
- 15999 Ohio 26
- 1117 Greene St
- 1005 Greene St
- 1099 Colegate Dr
- 201 E Spring St
- 1 Hickory Ln
- 150 Wells Ave
- 161 Woodland Ave
- 1289 Caywood Rd
- 1345 Caywood Rd
- 1445 Caywood Rd
- 1440 Caywood Rd
- 1460 Caywood Rd
- 1480 Caywood Rd
- 15207 Caywood Rd
- 1040 Caywood Rd
- 1270 Caywood Rd
- 1020 Caywood Rd
- 1010 Caywood Rd
- 980 Caywood Rd
- 525 Miller Ln
- 910 Caywood Rd
- 1718 Caywood Rd
- 780 Caywood Rd
- 1710 Caywood Rd
- 1750 Caywood Rd
- 740 Caywood Rd
- 1790 Caywood Rd