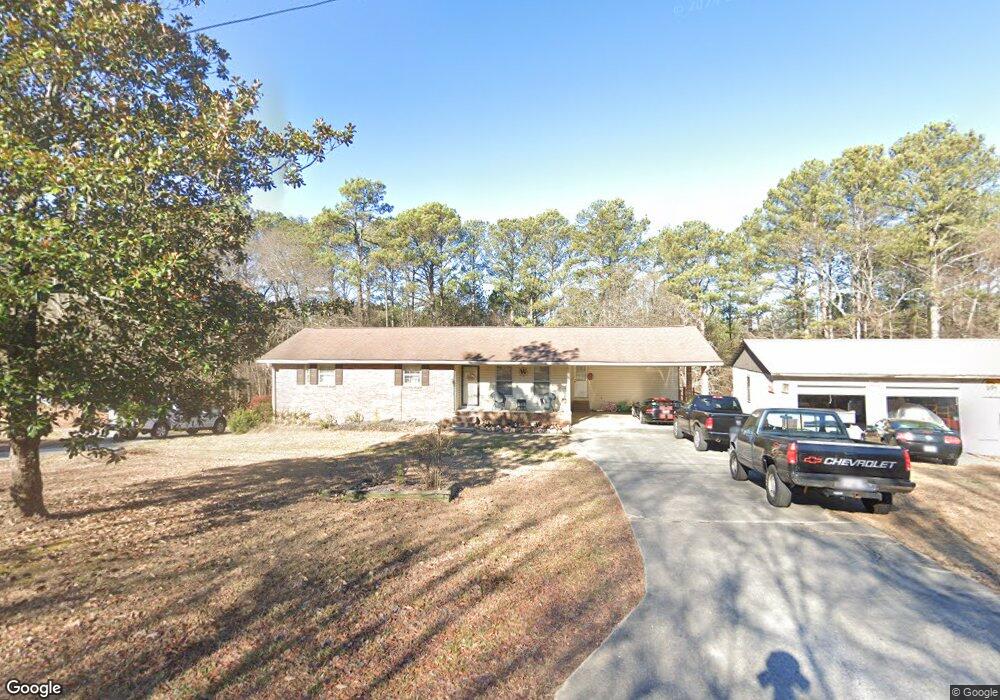
1285 Morris Rd Aragon, GA 30104
Estimated Value: $279,000 - $496,000
--
Bed
1
Bath
1,974
Sq Ft
$174/Sq Ft
Est. Value
About This Home
This home is located at 1285 Morris Rd, Aragon, GA 30104 and is currently estimated at $343,219, approximately $173 per square foot. 1285 Morris Rd is a home located in Floyd County with nearby schools including Pepperell Middle School and Pepperell High School.
Ownership History
Date
Name
Owned For
Owner Type
Purchase Details
Closed on
Oct 21, 1992
Bought by
P and R
Current Estimated Value
Purchase Details
Closed on
Dec 8, 1989
Sold by
Wright Charles A and Wright Glenda R
Bought by
Wright Charles A and Wright Regina
Purchase Details
Closed on
Oct 17, 1988
Bought by
P and R
Purchase Details
Closed on
Oct 14, 1988
Sold by
Patton Douglas E and Patton Linda W
Bought by
Wright Charles A and Wright Glenda R
Purchase Details
Closed on
Sep 30, 1983
Sold by
Grissett Richard S
Bought by
Patton Douglas E and Patton Linda W
Purchase Details
Closed on
Oct 2, 1974
Sold by
Hunsicker Charles and Hunsicker Shirley
Bought by
Grissett Richard S
Purchase Details
Closed on
Sep 6, 1974
Sold by
Osborne Eddie L and Osborne Linda F
Bought by
Hunsicker Charles and Hunsicker Shirley
Purchase Details
Closed on
Jul 15, 1974
Sold by
Agan Wallace R
Bought by
Osborne Eddie L and Osborne Linda F
Purchase Details
Closed on
Mar 1, 1974
Bought by
Agan Wallace R
Create a Home Valuation Report for This Property
The Home Valuation Report is an in-depth analysis detailing your home's value as well as a comparison with similar homes in the area
Home Values in the Area
Average Home Value in this Area
Purchase History
| Date | Buyer | Sale Price | Title Company |
|---|---|---|---|
| P | -- | -- | |
| Wright Charles A | -- | -- | |
| P | -- | -- | |
| Wright Charles A | -- | -- | |
| Patton Douglas E | $39,900 | -- | |
| Grissett Richard S | $3,000 | -- | |
| Hunsicker Charles | $2,000 | -- | |
| Osborne Eddie L | $5,000 | -- | |
| Agan Wallace R | -- | -- |
Source: Public Records
Tax History Compared to Growth
Tax History
| Year | Tax Paid | Tax Assessment Tax Assessment Total Assessment is a certain percentage of the fair market value that is determined by local assessors to be the total taxable value of land and additions on the property. | Land | Improvement |
|---|---|---|---|---|
| 2024 | $1,822 | $116,933 | $11,616 | $105,317 |
| 2023 | $2,256 | $103,289 | $10,560 | $92,729 |
| 2022 | $1,915 | $79,588 | $8,712 | $70,876 |
| 2021 | $1,716 | $66,991 | $7,930 | $59,061 |
| 2020 | $1,564 | $57,957 | $6,895 | $51,062 |
| 2019 | $1,514 | $56,243 | $6,895 | $49,348 |
| 2018 | $1,479 | $54,163 | $6,567 | $47,596 |
| 2017 | $1,459 | $52,886 | $6,081 | $46,805 |
| 2016 | $1,471 | $52,613 | $6,080 | $46,533 |
| 2015 | $1,442 | $52,613 | $6,080 | $46,533 |
| 2014 | $1,442 | $52,613 | $6,080 | $46,533 |
Source: Public Records
Map
Nearby Homes
- 320 Brumbelow Rd
- 2011 Bailey Rd SE
- 2557 Wax Rd SE
- 1424 Harmony Rd SE
- 52 Lloyd Dr SE
- 1337 Abrams Rd SE
- 838 Pleasant Hope Rd SE
- 4526 Rome Hwy
- 110 Williams Rd SE
- 463 Compton Rd SE
- 00 John Kay Rd
- 0 Hwy 101 and Dean Rd Unit 10620814
- 34 Hudson Loop Rd
- 330 Flint Hill Rd
- 6792 Rockmart Rd SE
- 180 Flint Hill Rd
- 1265 Morris Rd
- 1288 Morris Rd
- 1266 Morris Rd
- 1303 Morris Rd
- 1320 Morris Rd
- 1250 Morris Rd
- 0 Morris Rd Unit 8418508
- 0 Morris Rd Unit 7233198
- 0 Morris Rd Unit 7303477
- 0 Morris Rd Unit 7004003
- 0 Morris Rd Unit 7486717
- 0 Morris Rd Unit 8305630
- 0 Morris Rd Unit 8665620
- 1330 Morris Rd
- 1215 Morris Rd
- 1226 Morris Rd
- 1226 Morris Rd
- 3469 Wax Rd SE
- 3475 Old Wax Rd
- 3475 Old Wax Rd Se