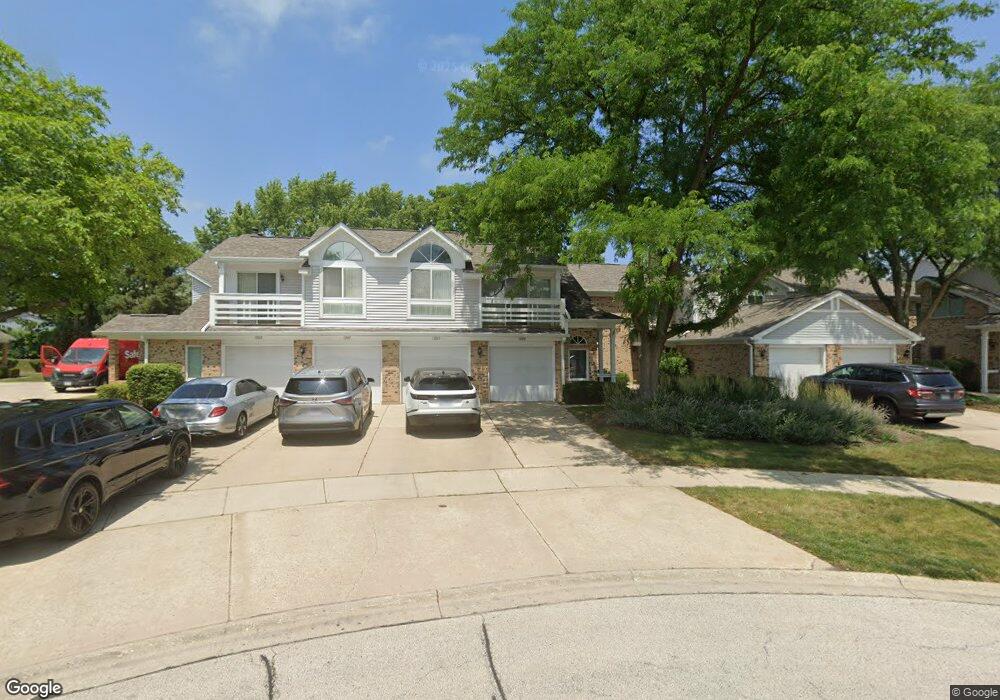
1285 Ranch View Ct Unit 5 Buffalo Grove, IL 60089
Prairie Park-Lake County NeighborhoodEstimated Value: $230,714 - $251,000
2
Beds
1
Bath
691
Sq Ft
$350/Sq Ft
Est. Value
About This Home
This home is located at 1285 Ranch View Ct Unit 5, Buffalo Grove, IL 60089 and is currently estimated at $241,679, approximately $349 per square foot. 1285 Ranch View Ct Unit 5 is a home located in Lake County with nearby schools including Prairie Elementary School, Twin Groves Middle School, and Adlai E Stevenson High School.
Ownership History
Date
Name
Owned For
Owner Type
Purchase Details
Closed on
Feb 27, 2004
Sold by
Rhodes Quanah T
Bought by
Weliczko Michael E
Current Estimated Value
Home Financials for this Owner
Home Financials are based on the most recent Mortgage that was taken out on this home.
Original Mortgage
$148,950
Outstanding Balance
$69,515
Interest Rate
5.65%
Mortgage Type
Unknown
Estimated Equity
$172,164
Purchase Details
Closed on
Feb 28, 2002
Sold by
Martin Amy J
Bought by
Rhodes Quanah T
Home Financials for this Owner
Home Financials are based on the most recent Mortgage that was taken out on this home.
Original Mortgage
$140,867
Interest Rate
6.93%
Mortgage Type
FHA
Purchase Details
Closed on
Jan 15, 1997
Sold by
Panfil Julie Ann
Bought by
Martin Amy J
Home Financials for this Owner
Home Financials are based on the most recent Mortgage that was taken out on this home.
Original Mortgage
$90,200
Interest Rate
7.66%
Create a Home Valuation Report for This Property
The Home Valuation Report is an in-depth analysis detailing your home's value as well as a comparison with similar homes in the area
Home Values in the Area
Average Home Value in this Area
Purchase History
| Date | Buyer | Sale Price | Title Company |
|---|---|---|---|
| Weliczko Michael E | $165,500 | Ticor Title Insurance Co | |
| Rhodes Quanah T | $145,000 | Chicago Title Insurance Co | |
| Martin Amy J | $93,000 | -- |
Source: Public Records
Mortgage History
| Date | Status | Borrower | Loan Amount |
|---|---|---|---|
| Open | Weliczko Michael E | $148,950 | |
| Previous Owner | Rhodes Quanah T | $140,867 | |
| Previous Owner | Martin Amy J | $90,200 |
Source: Public Records
Tax History Compared to Growth
Tax History
| Year | Tax Paid | Tax Assessment Tax Assessment Total Assessment is a certain percentage of the fair market value that is determined by local assessors to be the total taxable value of land and additions on the property. | Land | Improvement |
|---|---|---|---|---|
| 2024 | $4,639 | $56,410 | $30,642 | $25,768 |
| 2023 | $3,982 | $53,227 | $28,913 | $24,314 |
| 2022 | $3,982 | $44,184 | $24,001 | $20,183 |
| 2021 | $3,826 | $43,707 | $23,742 | $19,965 |
| 2020 | $3,737 | $43,856 | $23,823 | $20,033 |
| 2019 | $3,690 | $43,694 | $23,735 | $19,959 |
| 2018 | $3,204 | $39,871 | $25,799 | $14,072 |
| 2017 | $3,138 | $38,941 | $25,197 | $13,744 |
| 2016 | $3,038 | $37,289 | $24,128 | $13,161 |
| 2015 | $2,929 | $34,872 | $22,564 | $12,308 |
| 2014 | $3,885 | $43,738 | $24,235 | $19,503 |
| 2012 | $3,837 | $43,826 | $24,284 | $19,542 |
Source: Public Records
Map
Nearby Homes
- 1027 Courtland Dr Unit 20
- 1327 Larchmont Dr
- 5107 N Arlington Heights Rd
- 12 Cloverdale Ct
- 1315 Gail Dr
- 1325 Fairfax Ln
- 1117 Franklin Ln Unit C52
- 5135 Bridlewood Ct
- 810 Silver Rock Ln
- 760 Checker Dr
- 531 Lasalle Ln
- 620 Twisted Oak Ln
- 4106 Bob o Link Ln
- 5255 Danbury Ct
- 1514 Sumter Dr
- 630 Woodhollow Ln
- 938 Hidden Lake Dr
- 1545 Chickamauga Ln
- 2015 Tree Farm Ct
- 1272 Sandhurst Dr
- 1283 Ranch View Ct Unit 5
- 1287 Ranch View Ct
- 1287 Ranch View Ct Unit 1287
- 1281 Ranch View Ct Unit 5
- 1289 Ranch View Ct Unit 128
- 1279 Ranch View Ct
- 1277 Ranchview Ct
- 1277 Ranchview Ct
- 1277 Ranch View Ct Unit 5
- 1275 Ranchview Ct
- 1275 Ranch View Ct Unit 5
- 1273 Ranch View Ct Unit 52R
- 1360 Larchmont Dr
- 1364 Larchmont Dr
- 1271 Ranchview Ct
- 1271 Ranch View Ct Unit 5
- 1282 Ranch View Ct
- 1286 Ranch View Ct
- 1284 Ranch View Ct Unit 6
- 1284 Ranchview Ct