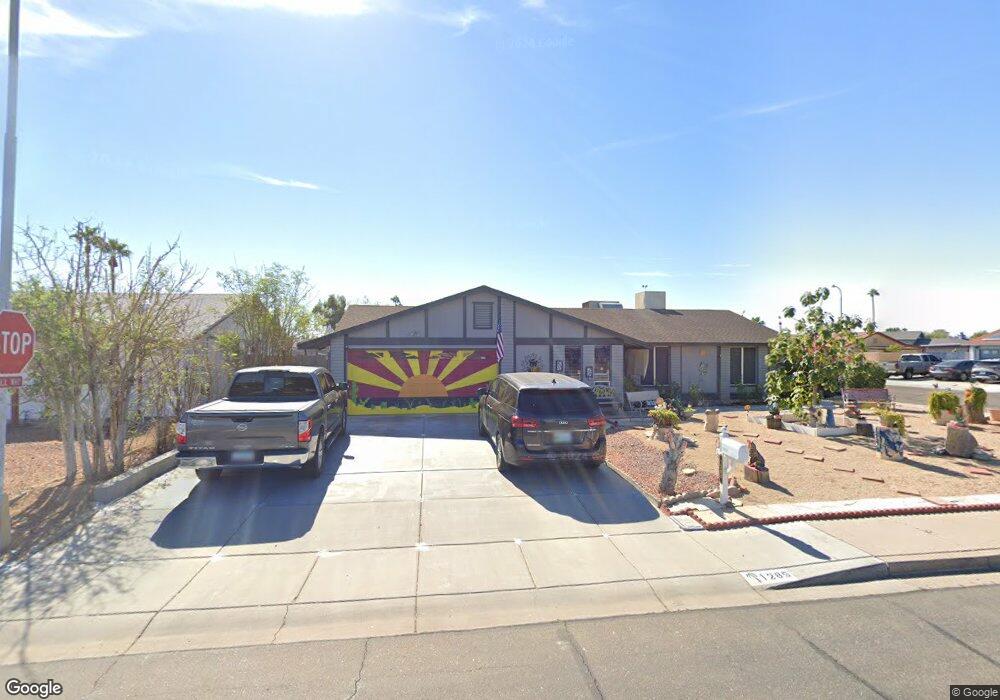
1285 W Mesquite St Chandler, AZ 85224
Amberwood NeighborhoodEstimated Value: $485,774 - $517,000
3
Beds
2
Baths
1,815
Sq Ft
$278/Sq Ft
Est. Value
About This Home
This home is located at 1285 W Mesquite St, Chandler, AZ 85224 and is currently estimated at $503,944, approximately $277 per square foot. 1285 W Mesquite St is a home located in Maricopa County with nearby schools including Pomeroy Elementary School, Franklin at Brimhall Elementary School, and Summit Academy Elementary.
Ownership History
Date
Name
Owned For
Owner Type
Purchase Details
Closed on
Jun 10, 2025
Sold by
Sandhu Ranjit S
Bought by
Sandhu Manpreet
Current Estimated Value
Purchase Details
Closed on
Sep 17, 2010
Sold by
Moore Gary
Bought by
Sandhu Ranjit S and Sandhu Neelam
Home Financials for this Owner
Home Financials are based on the most recent Mortgage that was taken out on this home.
Original Mortgage
$147,900
Interest Rate
4.25%
Mortgage Type
FHA
Purchase Details
Closed on
Dec 19, 2007
Sold by
Lee Justin H and Lee Lisa L
Bought by
Moore Gary
Home Financials for this Owner
Home Financials are based on the most recent Mortgage that was taken out on this home.
Original Mortgage
$230,850
Interest Rate
6.15%
Mortgage Type
Purchase Money Mortgage
Purchase Details
Closed on
Dec 14, 2007
Sold by
Moore Lisa
Bought by
Moore Gary
Home Financials for this Owner
Home Financials are based on the most recent Mortgage that was taken out on this home.
Original Mortgage
$230,850
Interest Rate
6.15%
Mortgage Type
Purchase Money Mortgage
Create a Home Valuation Report for This Property
The Home Valuation Report is an in-depth analysis detailing your home's value as well as a comparison with similar homes in the area
Home Values in the Area
Average Home Value in this Area
Purchase History
| Date | Buyer | Sale Price | Title Company |
|---|---|---|---|
| Sandhu Manpreet | -- | None Listed On Document | |
| Sandhu Ranjit S | $149,900 | Security Title Agency | |
| Moore Gary | $243,000 | Security Title Agency Inc | |
| Moore Gary | -- | Security Title Agency Inc |
Source: Public Records
Mortgage History
| Date | Status | Borrower | Loan Amount |
|---|---|---|---|
| Previous Owner | Sandhu Ranjit S | $147,900 | |
| Previous Owner | Moore Gary | $230,850 | |
| Previous Owner | Moore Gary | $230,850 |
Source: Public Records
Tax History Compared to Growth
Tax History
| Year | Tax Paid | Tax Assessment Tax Assessment Total Assessment is a certain percentage of the fair market value that is determined by local assessors to be the total taxable value of land and additions on the property. | Land | Improvement |
|---|---|---|---|---|
| 2025 | $1,560 | $18,287 | -- | -- |
| 2024 | $1,574 | $17,416 | -- | -- |
| 2023 | $1,574 | $35,910 | $7,180 | $28,730 |
| 2022 | $1,531 | $27,020 | $5,400 | $21,620 |
| 2021 | $1,540 | $23,870 | $4,770 | $19,100 |
| 2020 | $1,522 | $22,120 | $4,420 | $17,700 |
| 2019 | $1,402 | $20,600 | $4,120 | $16,480 |
| 2018 | $1,362 | $18,800 | $3,760 | $15,040 |
| 2017 | $1,309 | $17,360 | $3,470 | $13,890 |
| 2016 | $1,281 | $16,930 | $3,380 | $13,550 |
| 2015 | $1,205 | $16,600 | $3,320 | $13,280 |
Source: Public Records
Map
Nearby Homes
- 1224 W Mesquite St
- 2201 N Comanche Dr Unit 1080
- 2201 N Comanche Dr Unit 1104
- 2201 N Comanche Dr Unit 1018
- 2201 N Comanche Dr Unit 1002
- 1511 W Mesquite St
- 2609 N Pleasant Dr
- 812 W Rosal Place
- 1417 W Los Arboles Place
- 1403 W Los Arboles Place
- 1309 W Marlboro Dr
- 916 W Loughlin Dr
- 1203 W Alamo Dr
- 1807 W Mission Dr
- 2129 N Villas Ln
- 792 W El Monte Place Unit 8
- 1805 W Cheyenne Dr
- 1821 W Mission Dr
- 2712 N Evergreen St
- 2015 N Villas Ln
- 1273 W Mesquite St
- 1286 W Nopal Place
- 1261 W Mesquite St
- 2450 N Central Dr
- 1274 W Nopal Place
- 2420 N Central Dr
- 1262 W Nopal Place
- 1249 W Mesquite St
- 2414 N Central Dr
- 1303 W Mesquite St
- 1260 W Mesquite St
- 2396 N Central Dr
- 1250 W Nopal Place
- 1237 W Mesquite St
- 1305 W Mesquite St
- 1281 W Nopal Place
- 2384 N Central Dr
- 1248 W Mesquite St
- 1269 W Nopal Place
- 1238 W Nopal Place