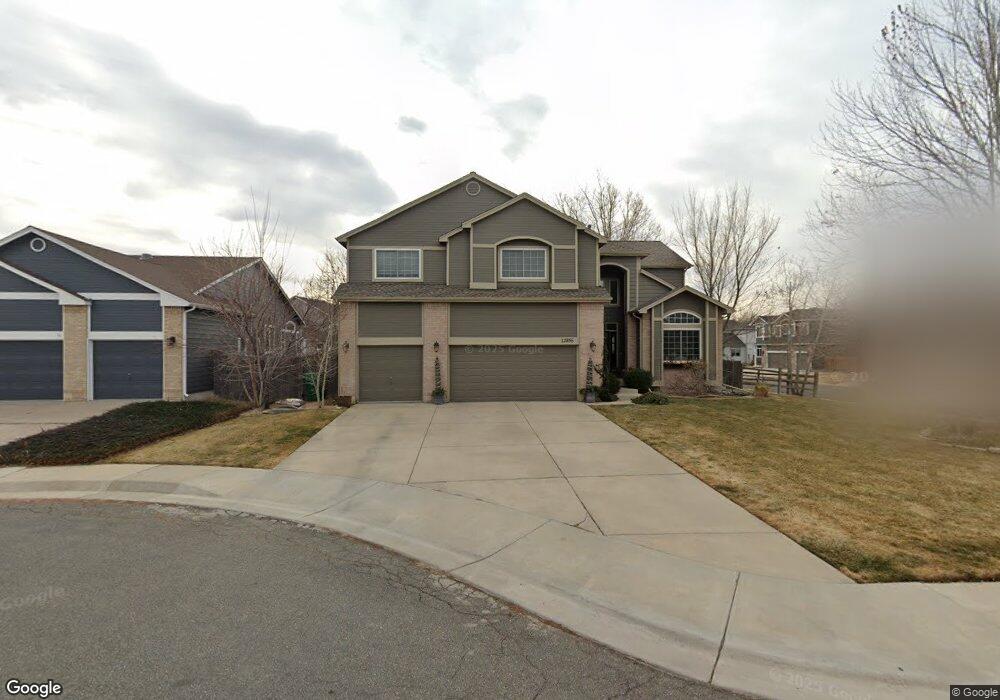
12856 W 53rd Place Arvada, CO 80002
Appleridge Estates NeighborhoodEstimated Value: $866,000 - $1,039,000
3
Beds
7
Baths
2,912
Sq Ft
$317/Sq Ft
Est. Value
About This Home
This home is located at 12856 W 53rd Place, Arvada, CO 80002 and is currently estimated at $923,609, approximately $317 per square foot. 12856 W 53rd Place is a home located in Jefferson County with nearby schools including Fairmount Elementary School, Drake Junior High School, and Arvada West High School.
Ownership History
Date
Name
Owned For
Owner Type
Purchase Details
Closed on
Jul 18, 2006
Sold by
Cunningham Mark S and Cunningham Laurel H
Bought by
Giarratano Richard Allen and Giarratano Pamela Deanne
Current Estimated Value
Home Financials for this Owner
Home Financials are based on the most recent Mortgage that was taken out on this home.
Original Mortgage
$328,000
Outstanding Balance
$194,403
Interest Rate
6.62%
Mortgage Type
New Conventional
Estimated Equity
$729,206
Purchase Details
Closed on
Jun 30, 1997
Sold by
Gallery At Cherrywood Inc
Bought by
Cunningham Mark S and Cunningham Laurel H
Home Financials for this Owner
Home Financials are based on the most recent Mortgage that was taken out on this home.
Original Mortgage
$135,000
Interest Rate
7.92%
Create a Home Valuation Report for This Property
The Home Valuation Report is an in-depth analysis detailing your home's value as well as a comparison with similar homes in the area
Home Values in the Area
Average Home Value in this Area
Purchase History
| Date | Buyer | Sale Price | Title Company |
|---|---|---|---|
| Giarratano Richard Allen | $410,000 | Security Title | |
| Cunningham Mark S | $231,828 | Land Title |
Source: Public Records
Mortgage History
| Date | Status | Borrower | Loan Amount |
|---|---|---|---|
| Open | Giarratano Richard Allen | $328,000 | |
| Previous Owner | Cunningham Mark S | $135,000 |
Source: Public Records
Tax History Compared to Growth
Tax History
| Year | Tax Paid | Tax Assessment Tax Assessment Total Assessment is a certain percentage of the fair market value that is determined by local assessors to be the total taxable value of land and additions on the property. | Land | Improvement |
|---|---|---|---|---|
| 2024 | $5,398 | $55,439 | $10,018 | $45,421 |
| 2023 | $5,398 | $55,439 | $10,018 | $45,421 |
| 2022 | $4,264 | $43,375 | $11,384 | $31,991 |
| 2021 | $4,326 | $44,622 | $11,711 | $32,911 |
| 2020 | $3,904 | $40,326 | $13,652 | $26,674 |
| 2019 | $3,850 | $40,326 | $13,652 | $26,674 |
| 2018 | $3,636 | $37,030 | $10,208 | $26,822 |
| 2017 | $3,328 | $37,030 | $10,208 | $26,822 |
| 2016 | $3,668 | $38,391 | $9,791 | $28,600 |
| 2015 | $3,146 | $38,391 | $9,791 | $28,600 |
| 2014 | $3,146 | $32,182 | $8,597 | $23,585 |
Source: Public Records
Map
Nearby Homes
- 5188 Ward Rd
- 5160 Ward Rd
- 5173 Vivian St
- 5555 Ward Rd
- 5284 Braun St
- 12355 W 51st Ave
- 12081 W 54th Ave
- 5154 Taft Ct
- 13030 W 58th Ave
- 5795 Xenon Way
- 11958 W 57th Place
- 5240 Routt Ct Unit B
- 11944 W 57th Dr
- 11924 W 57th Dr
- 5779 Taft St
- 5287 Flora Way
- 12321 W 58th Dr
- 5182 Rob Way
- 12017 W 58th Place
- 5194 Queen Ct
- 12846 W 53rd Place
- 12853 W 52nd Place
- 12843 W 52nd Place
- 12836 W 53rd Place
- 5371 Youngfield Way
- 5341 Youngfield Way
- 12855 W 53rd Place
- 5391 Youngfield Way
- 12835 W 53rd Place
- 5311 Youngfield Way
- 12833 W 52nd Place
- 12845 W 53rd Place
- 5401 Youngfield Way
- 5281 Youngfield Way
- 5372 Yank Way
- 5342 Yank Way
- 12858 W 54th Place
- 12848 W 54th Place
- 5392 Yank Way
- 12834 W 52nd Place