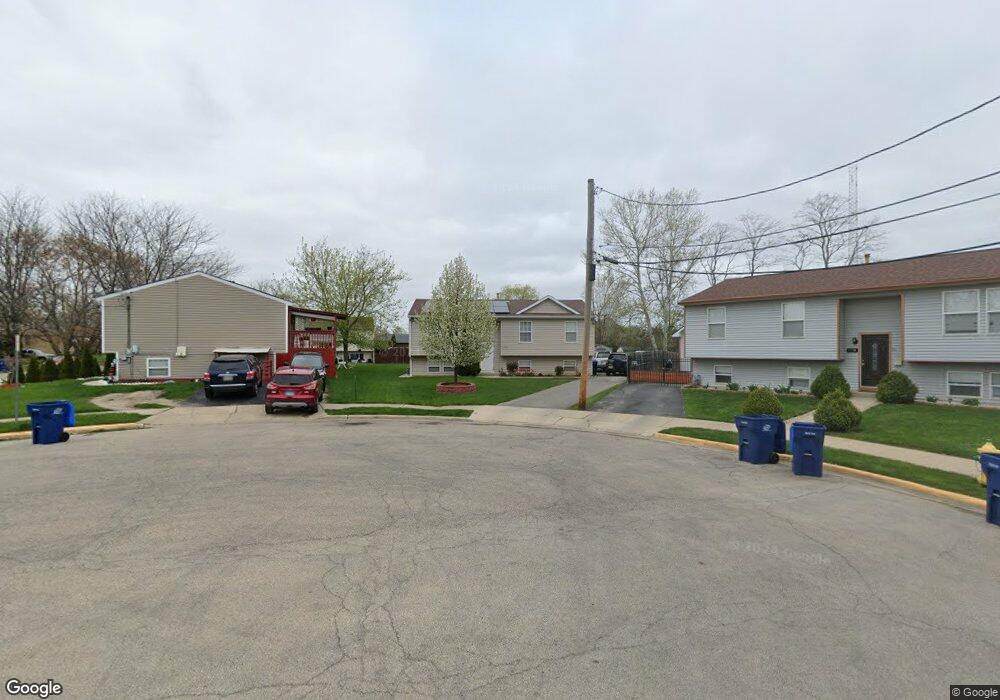
1286 W Paul St Waukegan, IL 60085
Pine Trail Estates NeighborhoodEstimated Value: $211,000 - $252,352
--
Bed
2
Baths
1,092
Sq Ft
$212/Sq Ft
Est. Value
About This Home
This home is located at 1286 W Paul St, Waukegan, IL 60085 and is currently estimated at $231,588, approximately $212 per square foot. 1286 W Paul St is a home located in Lake County with nearby schools including Hyde Park Elementary School, Miguel Juarez Middle School, and Waukegan High School.
Ownership History
Date
Name
Owned For
Owner Type
Purchase Details
Closed on
May 10, 2006
Sold by
Paz Norma C and Avila Santos E
Bought by
Paz Norma C and Murillo Eleazar
Current Estimated Value
Purchase Details
Closed on
Dec 10, 1999
Sold by
Binning Stan and Baig Rasheed
Bought by
Paz Norma C and Avila Santos E
Home Financials for this Owner
Home Financials are based on the most recent Mortgage that was taken out on this home.
Original Mortgage
$136,861
Outstanding Balance
$42,876
Interest Rate
7.87%
Mortgage Type
FHA
Estimated Equity
$188,712
Purchase Details
Closed on
Jan 14, 1998
Sold by
Bank Of Waukegan
Bought by
Binning Stan and Baig Rasheed
Home Financials for this Owner
Home Financials are based on the most recent Mortgage that was taken out on this home.
Original Mortgage
$117,000
Interest Rate
8.5%
Mortgage Type
Seller Take Back
Create a Home Valuation Report for This Property
The Home Valuation Report is an in-depth analysis detailing your home's value as well as a comparison with similar homes in the area
Home Values in the Area
Average Home Value in this Area
Purchase History
| Date | Buyer | Sale Price | Title Company |
|---|---|---|---|
| Paz Norma C | -- | None Available | |
| Paz Norma C | $138,000 | -- | |
| Binning Stan | -- | -- | |
| Bank Of Waukegan | $156,000 | -- |
Source: Public Records
Mortgage History
| Date | Status | Borrower | Loan Amount |
|---|---|---|---|
| Open | Paz Norma C | $136,861 | |
| Previous Owner | Binning Stan | $117,000 |
Source: Public Records
Tax History Compared to Growth
Tax History
| Year | Tax Paid | Tax Assessment Tax Assessment Total Assessment is a certain percentage of the fair market value that is determined by local assessors to be the total taxable value of land and additions on the property. | Land | Improvement |
|---|---|---|---|---|
| 2024 | $1,235 | $85,441 | $14,563 | $70,878 |
| 2023 | $4,804 | $76,495 | $13,038 | $63,457 |
| 2022 | $4,804 | $60,145 | $11,885 | $48,260 |
| 2021 | $1,887 | $64,709 | $11,196 | $53,513 |
| 2020 | $2,052 | $60,284 | $10,430 | $49,854 |
| 2019 | $5,526 | $55,240 | $9,557 | $45,683 |
| 2018 | $4,971 | $48,451 | $11,272 | $37,179 |
| 2017 | $4,533 | $42,866 | $9,973 | $32,893 |
| 2016 | $4,056 | $37,249 | $8,666 | $28,583 |
| 2015 | $3,773 | $33,338 | $7,756 | $25,582 |
| 2014 | $3,205 | $29,098 | $4,472 | $24,626 |
| 2012 | $4,532 | $31,525 | $4,845 | $26,680 |
Source: Public Records
Map
Nearby Homes
- 511 Chestnut St
- 428 N Poplar St
- 522 N Poplar St
- 824 N Butrick St
- 702 Franklin St
- 620 N Poplar St
- 1109 Massena Ave
- 917 N Linden Ave
- 1416 Hamilton Ct
- 23 N Jackson St
- 1000 Pine St
- 452 North Ave
- 28 N Saint James St
- 918 N Ash St
- 968 Judge Ave
- 1213 Grand Ave
- 1105 Woodlawn Cir
- 613 Washington St
- 2115 Lydia St
- 325 4th St