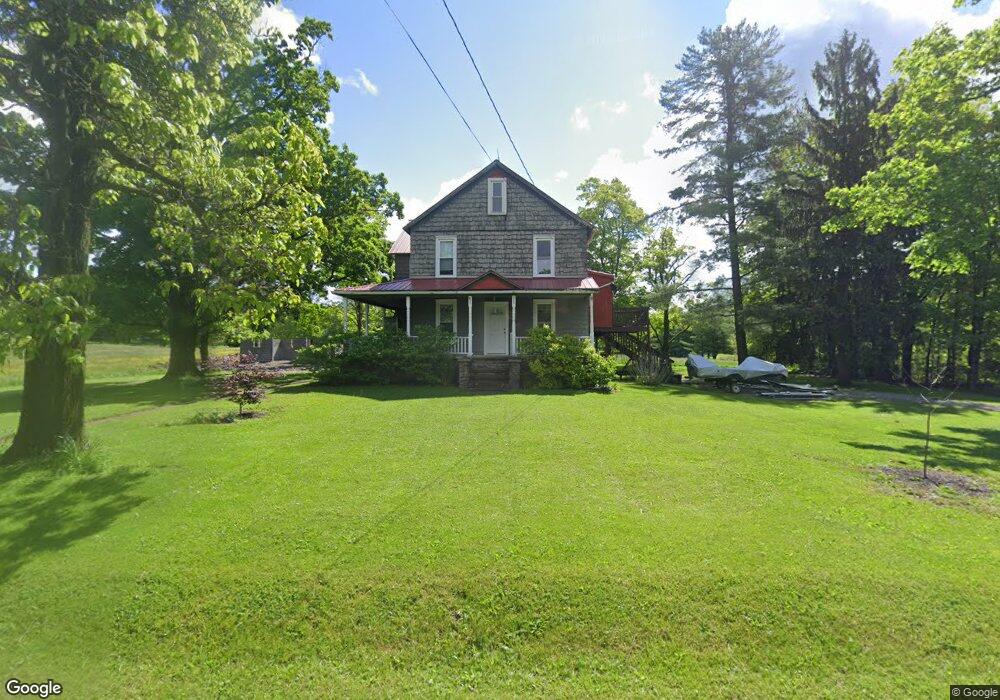
12861 Princeton Rd Unit Lower Huntsburg, OH 44046
Estimated Value: $306,000 - $332,786
2
Beds
1
Bath
1,257
Sq Ft
$257/Sq Ft
Est. Value
About This Home
This home is located at 12861 Princeton Rd Unit Lower, Huntsburg, OH 44046 and is currently estimated at $323,447, approximately $257 per square foot. 12861 Princeton Rd Unit Lower is a home located in Geauga County with nearby schools including Jordak Elementary School, Cardinal Middle School, and Cardinal High School.
Ownership History
Date
Name
Owned For
Owner Type
Purchase Details
Closed on
Mar 28, 2025
Sold by
Kruse Luke
Bought by
Byler Owen I and Byler Nevin R
Current Estimated Value
Home Financials for this Owner
Home Financials are based on the most recent Mortgage that was taken out on this home.
Original Mortgage
$225,000
Outstanding Balance
$218,378
Interest Rate
6.87%
Mortgage Type
Balloon
Estimated Equity
$105,069
Purchase Details
Closed on
Feb 12, 2003
Sold by
Schlevenski Bonnie L
Bought by
Schlevenski Joseph Allen
Home Financials for this Owner
Home Financials are based on the most recent Mortgage that was taken out on this home.
Original Mortgage
$167,050
Interest Rate
5.94%
Purchase Details
Closed on
Jan 1, 1990
Bought by
Schlevenski Joseph
Create a Home Valuation Report for This Property
The Home Valuation Report is an in-depth analysis detailing your home's value as well as a comparison with similar homes in the area
Home Values in the Area
Average Home Value in this Area
Purchase History
| Date | Buyer | Sale Price | Title Company |
|---|---|---|---|
| Byler Owen I | $325,000 | None Listed On Document | |
| Byler Owen I | $325,000 | None Listed On Document | |
| Schlevenski Joseph Allen | -- | Competitive Title | |
| Schlevenski Joseph | -- | -- |
Source: Public Records
Mortgage History
| Date | Status | Borrower | Loan Amount |
|---|---|---|---|
| Open | Byler Owen I | $225,000 | |
| Closed | Byler Owen I | $225,000 | |
| Previous Owner | Schlevenski Joseph Allen | $167,050 |
Source: Public Records
Tax History Compared to Growth
Tax History
| Year | Tax Paid | Tax Assessment Tax Assessment Total Assessment is a certain percentage of the fair market value that is determined by local assessors to be the total taxable value of land and additions on the property. | Land | Improvement |
|---|---|---|---|---|
| 2024 | $2,729 | $69,870 | $19,010 | $50,860 |
| 2023 | $2,729 | $69,870 | $19,010 | $50,860 |
| 2022 | $2,321 | $47,530 | $15,820 | $31,710 |
| 2021 | $2,173 | $47,530 | $15,820 | $31,710 |
| 2020 | $2,246 | $47,530 | $15,820 | $31,710 |
| 2019 | $220 | $42,910 | $15,820 | $27,090 |
| 2018 | $2,195 | $42,910 | $15,820 | $27,090 |
| 2017 | $2,195 | $42,910 | $15,820 | $27,090 |
| 2016 | $1,791 | $39,970 | $15,820 | $24,150 |
| 2015 | $1,698 | $39,970 | $15,820 | $24,150 |
| 2014 | $1,698 | $39,970 | $15,820 | $24,150 |
| 2013 | $1,739 | $39,970 | $15,820 | $24,150 |
Source: Public Records
Map
Nearby Homes
- 13137 Old State Rd
- 15575 Stillwell Rd
- 16270 Mayfield Rd
- 13689 Old State Rd
- 14686 Mayfield Rd
- 13105 Madison Rd
- 12342 Madison Rd
- 0 Old State Rd Unit 5157703
- 11976 Old State Rd
- 13181 Claridon Troy Rd
- 11470 Clay St
- VL Clay St
- 16080 Chardon Windsor Rd
- 12175 Hunt Rd
- 14452 Burton Windsor Rd
- 11352 Old State Rd
- 11698 Claridon Troy Rd
- 16298 Weathervane Dr
- 16008 Button St
- 14706 Steeplechase Dr
- 12858 Princeton Rd
- 12889 Princeton Rd
- 15641 Pioneer Rd
- 12927 Princeton Rd
- 12825 Princeton Rd
- 12835 Princeton Rd
- 15610 Pioneer Rd
- 12912 Princeton Rd
- 15630 Pioneer Rd
- 12815 Princeton Rd
- 12924 Princeton Rd
- 15679 Pioneer Rd
- 15650 Pioneer Rd
- 12955 Princeton Rd
- 15719 Pioneer Rd
- 15676 Pioneer Rd
- 12791 Princeton Rd
- 15723 Pioneer Rd
- 15696 Pioneer Rd
- 12761 Princeton Rd