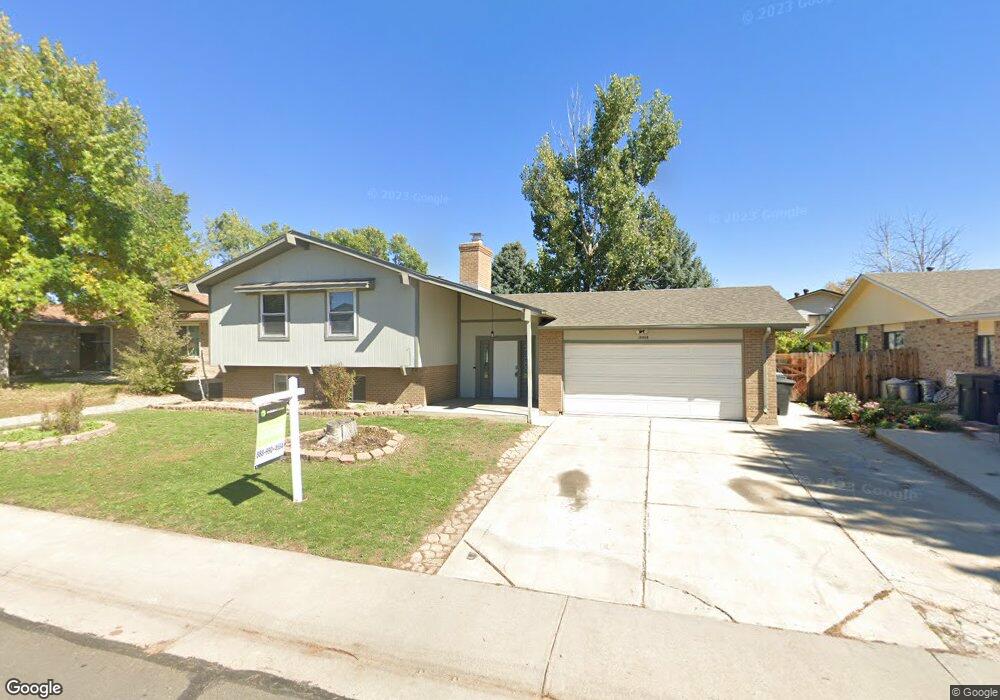
12862 Clermont St Thornton, CO 80241
Country Hills NeighborhoodEstimated Value: $518,000 - $555,000
4
Beds
3
Baths
2,204
Sq Ft
$243/Sq Ft
Est. Value
About This Home
This home is located at 12862 Clermont St, Thornton, CO 80241 and is currently estimated at $535,559, approximately $242 per square foot. 12862 Clermont St is a home located in Adams County with nearby schools including Eagleview Elementary School, Rocky Top Middle School, and Horizon High School.
Ownership History
Date
Name
Owned For
Owner Type
Purchase Details
Closed on
Jun 7, 2019
Sold by
2019 1H Borrower Lp
Bought by
2019 1H Borrower Lp
Current Estimated Value
Purchase Details
Closed on
Nov 3, 2016
Sold by
Inverclyde Llc
Bought by
Chs 2016 2 Borrower Llc
Purchase Details
Closed on
Dec 23, 2014
Sold by
Riley R Todd and Riley Deborah K
Bought by
Inverclayde Llc
Purchase Details
Closed on
May 25, 2000
Sold by
Campbell Carolyn S
Bought by
Riley R Todd and Riley Deborah K
Home Financials for this Owner
Home Financials are based on the most recent Mortgage that was taken out on this home.
Original Mortgage
$182,991
Interest Rate
8.5%
Mortgage Type
FHA
Create a Home Valuation Report for This Property
The Home Valuation Report is an in-depth analysis detailing your home's value as well as a comparison with similar homes in the area
Home Values in the Area
Average Home Value in this Area
Purchase History
| Date | Buyer | Sale Price | Title Company |
|---|---|---|---|
| 2019 1H Borrower Lp | -- | Os National Llc | |
| Chs 2016 2 Borrower Llc | -- | None Available | |
| Inverclayde Llc | $245,000 | Chicago Title Co | |
| Riley R Todd | $184,500 | -- |
Source: Public Records
Mortgage History
| Date | Status | Borrower | Loan Amount |
|---|---|---|---|
| Previous Owner | Riley R Todd | $182,991 |
Source: Public Records
Tax History Compared to Growth
Tax History
| Year | Tax Paid | Tax Assessment Tax Assessment Total Assessment is a certain percentage of the fair market value that is determined by local assessors to be the total taxable value of land and additions on the property. | Land | Improvement |
|---|---|---|---|---|
| 2024 | $3,229 | $29,880 | $6,250 | $23,630 |
| 2023 | $3,196 | $34,910 | $6,160 | $28,750 |
| 2022 | $2,980 | $27,050 | $6,320 | $20,730 |
| 2021 | $3,080 | $27,050 | $6,320 | $20,730 |
| 2020 | $2,742 | $24,580 | $6,510 | $18,070 |
| 2019 | $2,748 | $24,580 | $6,510 | $18,070 |
| 2018 | $2,468 | $21,450 | $6,840 | $14,610 |
| 2017 | $2,244 | $21,450 | $6,840 | $14,610 |
| 2016 | $2,013 | $18,730 | $3,660 | $15,070 |
| 2015 | $2,010 | $18,730 | $3,660 | $15,070 |
| 2014 | -- | $17,910 | $3,100 | $14,810 |
Source: Public Records
Map
Nearby Homes
- 12865 Clermont St
- 12943 Dexter Way
- 13022 Bellaire St
- 12780 Elm St
- 3850 E 128th Way
- 12814 Jackson Cir
- 13068 Harrison Dr
- 13263 Clermont Cir
- 13080 Harrison Dr
- 12698 Fairfax St
- 12694 Fairfax St
- 5341 E 129th Way
- 12711 Colorado Blvd Unit 914
- 12711 Colorado Blvd Unit 714
- 13028 Grape Ct
- 3802 E 127th Ln
- 12579 Forest Dr
- 13346 Birch Cir
- 12604 Madison Way
- 13243 Holly St Unit F
- 12872 Clermont St
- 12852 Clermont St
- 12907 Cherry Way
- 12903 Cherry Way
- 12913 Cherry Way
- 12882 Clermont St
- 12842 Clermont St
- 12855 Clermont St
- 12845 Clermont St
- 12917 Cherry Way
- 12883 Cherry Way
- 12875 Clermont St
- 12835 Clermont St
- 12888 Clermont St
- 12832 Clermont St
- 12923 Cherry Way
- 12853 Cherry Way
- 12912 Cherry Way
- 12846 Birch Dr
- 12836 Birch Dr