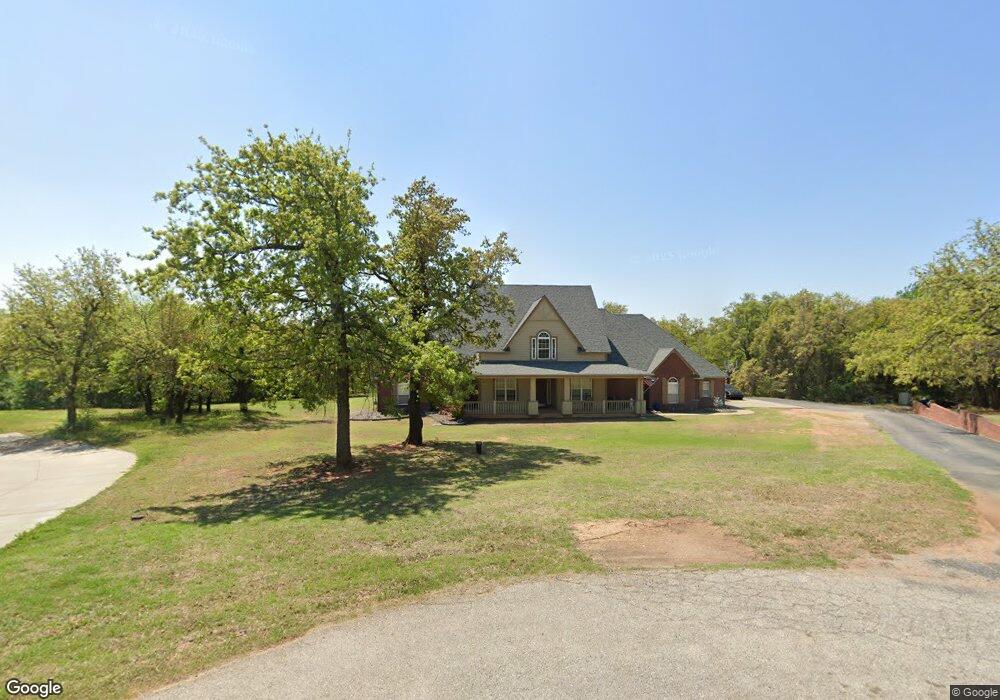
1287 Blackjack Cir Blanchard, OK 73010
West Blanchard NeighborhoodEstimated Value: $400,000 - $579,000
3
Beds
4
Baths
3,159
Sq Ft
$145/Sq Ft
Est. Value
About This Home
This home is located at 1287 Blackjack Cir, Blanchard, OK 73010 and is currently estimated at $459,049, approximately $145 per square foot. 1287 Blackjack Cir is a home located in Grady County with nearby schools including Blanchard Elementary School, Blanchard Intermediate School, and Blanchard Middle School.
Ownership History
Date
Name
Owned For
Owner Type
Purchase Details
Closed on
Mar 11, 2010
Sold by
Morgan Stanley Mort. Capi
Bought by
Mayfield Jessica P
Current Estimated Value
Purchase Details
Closed on
Nov 17, 2009
Sold by
Walden Lisa G
Bought by
Fv-1 In Trust For Morgan Stanley Mortgag
Purchase Details
Closed on
Mar 7, 2005
Sold by
Black Jack Development Llc
Bought by
Walden Ronnie and Walden Lisa
Home Financials for this Owner
Home Financials are based on the most recent Mortgage that was taken out on this home.
Original Mortgage
$177,757
Interest Rate
5.71%
Mortgage Type
Construction
Create a Home Valuation Report for This Property
The Home Valuation Report is an in-depth analysis detailing your home's value as well as a comparison with similar homes in the area
Home Values in the Area
Average Home Value in this Area
Purchase History
| Date | Buyer | Sale Price | Title Company |
|---|---|---|---|
| Mayfield Jessica P | $200,000 | -- | |
| Fv-1 In Trust For Morgan Stanley Mortgag | $213,400 | None Available | |
| Walden Ronnie | $25,000 | None Available |
Source: Public Records
Mortgage History
| Date | Status | Borrower | Loan Amount |
|---|---|---|---|
| Previous Owner | Walden Ronnie | $177,757 |
Source: Public Records
Tax History Compared to Growth
Tax History
| Year | Tax Paid | Tax Assessment Tax Assessment Total Assessment is a certain percentage of the fair market value that is determined by local assessors to be the total taxable value of land and additions on the property. | Land | Improvement |
|---|---|---|---|---|
| 2025 | $3,903 | $38,109 | $4,171 | $33,938 |
| 2024 | $3,903 | $36,999 | $4,050 | $32,949 |
| 2023 | $3,903 | $35,921 | $4,957 | $30,964 |
| 2022 | $3,679 | $34,876 | $4,957 | $29,919 |
| 2021 | $3,573 | $33,859 | $4,957 | $28,902 |
| 2020 | $3,961 | $32,873 | $4,957 | $27,916 |
| 2019 | $3,923 | $32,018 | $4,957 | $27,061 |
| 2018 | $3,612 | $32,467 | $5,117 | $27,350 |
| 2017 | $3,979 | $32,625 | $5,097 | $27,528 |
| 2016 | $3,595 | $31,675 | $4,346 | $27,329 |
| 2015 | $3,462 | $30,752 | $4,361 | $26,391 |
| 2014 | $3,462 | $29,857 | $4,030 | $25,827 |
Source: Public Records
Map
Nearby Homes
- 2288 County Road 1335
- 1301 Red Oak Ln
- 2400 Whiteoak Dr
- 1927 Hackney Ct
- 2356 SW 7th St
- 813 Summer Oaks Dr
- 792 Stone Dr
- 1778 Ruby Dr
- 1603 SW 22nd St
- 0 S Morgan Ave
- Deschutes Plan at Southern Trace
- Rio Grande Plan at Southern Trace
- Allegheny Plan at Southern Trace
- Nez Perce Plan at Southern Trace
- Williamette Plan at Southern Trace
- Bighorn Plan at Southern Trace
- Prescott Plan at Southern Trace
- Fremont Plan at Southern Trace
- Hiawatha Plan at Southern Trace
- Malheur Plan at Southern Trace
- 2407 Blackjack Ln
- 2405 Blackjack Ln
- 2410 Blackjack Ln
- 1288 Blackjack Cir
- 1273 Blackjack Cir
- 1230 Blackjack Cir
- 1225 Blackjack Cir
- 2290 Oakmont Dr
- 1900 Rock Oak Place
- 1178 Blackjack Ln
- 2260 Oakmont Dr
- 1896 Rock Oak Place
- 1186 Blackjack Cir
- 1901 Rock Oak Place
- 2250 Oakmont Dr
- 2120 Oakmont Dr
- 2200 Oakmont Dr
- 2065 Oakmont Dr
- 1381 Red Oak Ln