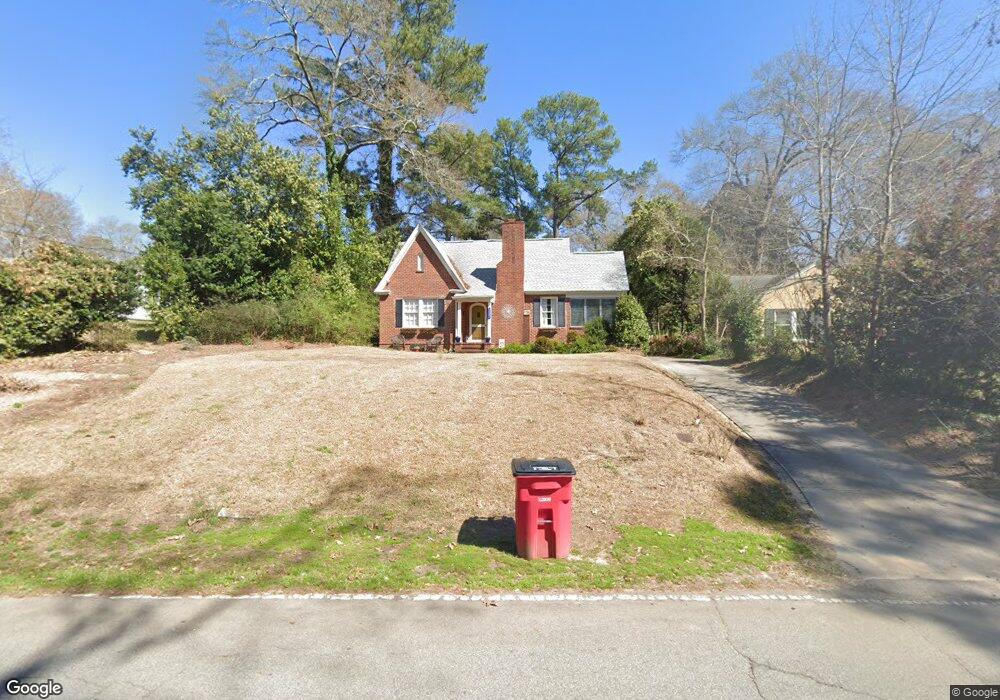
1287 Briarcliff Rd Macon, GA 31211
Estimated Value: $129,000 - $160,461
2
Beds
2
Baths
1,520
Sq Ft
$96/Sq Ft
Est. Value
About This Home
This home is located at 1287 Briarcliff Rd, Macon, GA 31211 and is currently estimated at $146,365, approximately $96 per square foot. 1287 Briarcliff Rd is a home located in Bibb County with nearby schools including Martin Luther King Jr. Elementary School, Appling Middle School, and Northeast High School.
Ownership History
Date
Name
Owned For
Owner Type
Purchase Details
Closed on
Nov 21, 2017
Sold by
Godfrey Pamela G
Bought by
Godfrey Pamela G and Godfrey Timothy P
Current Estimated Value
Purchase Details
Closed on
Jun 18, 2010
Sold by
Federal Home Loan Mortgage Corporation
Bought by
Godfrey Pamela G
Home Financials for this Owner
Home Financials are based on the most recent Mortgage that was taken out on this home.
Original Mortgage
$77,077
Interest Rate
4.83%
Mortgage Type
FHA
Purchase Details
Closed on
Aug 4, 2009
Sold by
Wilkes Nina
Bought by
Federal Home Loan Mort Corp
Create a Home Valuation Report for This Property
The Home Valuation Report is an in-depth analysis detailing your home's value as well as a comparison with similar homes in the area
Home Values in the Area
Average Home Value in this Area
Purchase History
| Date | Buyer | Sale Price | Title Company |
|---|---|---|---|
| Godfrey Pamela G | -- | None Available | |
| Godfrey Pamela G | $78,500 | None Available | |
| Federal Home Loan Mort Corp | -- | -- | |
| Federal Home Loan Mortgage Corp | $83,641 | None Available | |
| Wells Fargo Bank Na | $83,641 | None Available |
Source: Public Records
Mortgage History
| Date | Status | Borrower | Loan Amount |
|---|---|---|---|
| Previous Owner | Godfrey Pamela G | $77,077 |
Source: Public Records
Tax History Compared to Growth
Tax History
| Year | Tax Paid | Tax Assessment Tax Assessment Total Assessment is a certain percentage of the fair market value that is determined by local assessors to be the total taxable value of land and additions on the property. | Land | Improvement |
|---|---|---|---|---|
| 2025 | $1,211 | $56,273 | $7,560 | $48,713 |
| 2024 | $1,251 | $56,273 | $7,560 | $48,713 |
| 2023 | $1,460 | $56,273 | $7,560 | $48,713 |
| 2022 | $1,086 | $38,358 | $5,130 | $33,228 |
| 2021 | $1,192 | $38,358 | $5,130 | $33,228 |
| 2020 | $1,217 | $38,358 | $5,130 | $33,228 |
| 2019 | $1,228 | $38,358 | $5,130 | $33,228 |
| 2018 | $2,060 | $38,358 | $5,130 | $33,228 |
| 2017 | $1,175 | $38,358 | $5,130 | $33,228 |
| 2016 | $1,085 | $38,359 | $5,130 | $33,228 |
| 2015 | $1,536 | $38,359 | $5,130 | $33,228 |
| 2014 | $1,818 | $38,359 | $5,130 | $33,228 |
Source: Public Records
Map
Nearby Homes
- 1260 Jackson Springs Rd
- 1615 Engle Dr
- 1715 Foster Place
- 1746 Upper River Rd
- 1735 Foster Place
- 988 North Ave
- 980 Curry Place
- 1020 Clay Ave
- 1006 Clay Ave Unit 1008,1020,1022
- 1158 Jackson Springs Rd
- 1976 Long Ridge Dr
- 1971 Long Ridge Dr
- 1987 Long Ridge Dr
- 916 Summit Ave
- 1435 Twin Pines Dr
- 1485 Lone Oak Dr
- 940 Curry Dr
- 939 Boulevard
- 661 Coleman Ln
- 1831 Upper River Rd
- 1295 Briarcliff Rd
- 1275 Briarcliff Rd
- 1301 Briarcliff Cir
- 1301 Briarcliff Cir Unit B
- 1293 S Jackson Springs Rd
- 1271 Briarcliff Rd
- 1267 Briarcliff Rd
- 1289 S Jackson Springs Rd
- 1305 Briarcliff Cir
- 1296 Jackson Springs Rd
- 1255 Briarcliff Rd
- 1281 S Jackson Springs Rd
- 1287 Jackson Springs Rd
- 1324 Walls Rd
- 1316 Walls Rd
- 1320 Briarcliff Rd
- 1290 Jackson Springs Rd
- 1425 Walls Ln
- 1330 Briarcliff Rd
- 1427 Walls Ln