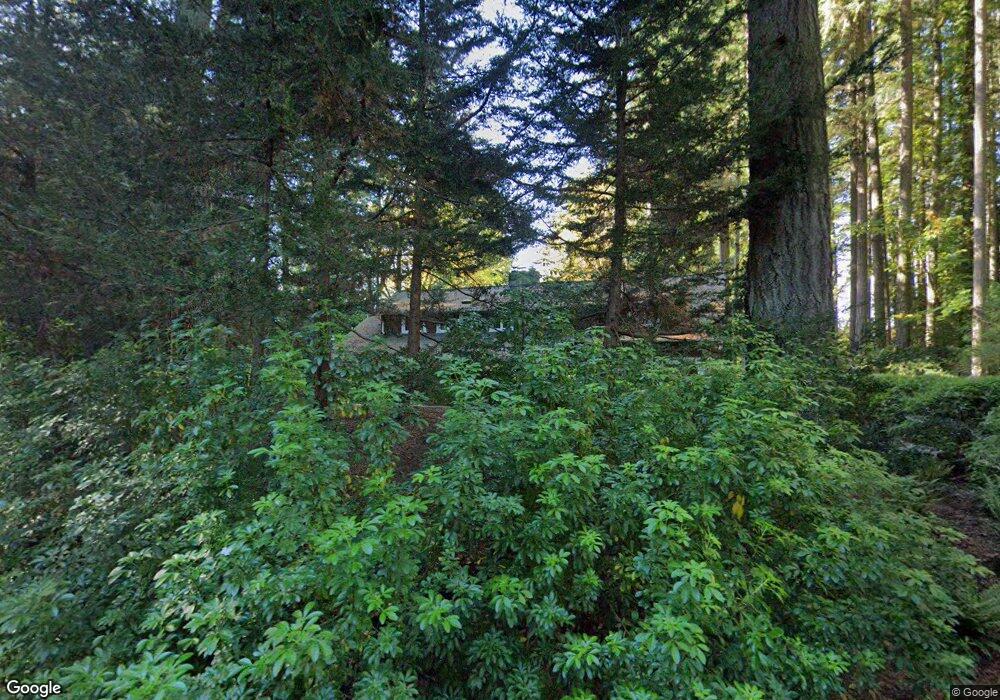
12875 Manzanita Rd NE Bainbridge Island, WA 98110
Estimated Value: $1,278,000 - $1,665,000
3
Beds
3
Baths
2,740
Sq Ft
$532/Sq Ft
Est. Value
About This Home
This home is located at 12875 Manzanita Rd NE, Bainbridge Island, WA 98110 and is currently estimated at $1,458,665, approximately $532 per square foot. 12875 Manzanita Rd NE is a home located in Kitsap County with nearby schools including Bainbridge High School and The Island School.
Ownership History
Date
Name
Owned For
Owner Type
Purchase Details
Closed on
Dec 5, 2006
Sold by
Frame Charles D and Frame Carolyn G
Bought by
Allan John Ridgway and Allan Susan M
Current Estimated Value
Purchase Details
Closed on
Nov 26, 2002
Sold by
Miller Sarah L
Bought by
Frame Charles and Frame Carolyn
Home Financials for this Owner
Home Financials are based on the most recent Mortgage that was taken out on this home.
Original Mortgage
$427,000
Interest Rate
4.9%
Mortgage Type
Purchase Money Mortgage
Purchase Details
Closed on
May 17, 1999
Sold by
Flora Donald F and Flora Margaret C
Bought by
Miller Sarah L
Home Financials for this Owner
Home Financials are based on the most recent Mortgage that was taken out on this home.
Original Mortgage
$166,000
Interest Rate
6.92%
Create a Home Valuation Report for This Property
The Home Valuation Report is an in-depth analysis detailing your home's value as well as a comparison with similar homes in the area
Home Values in the Area
Average Home Value in this Area
Purchase History
| Date | Buyer | Sale Price | Title Company |
|---|---|---|---|
| Allan John Ridgway | $746,280 | Rainier Title Company | |
| Frame Charles | $449,500 | Pacific Nw Title | |
| Miller Sarah L | $366,000 | Pacific Nw Title |
Source: Public Records
Mortgage History
| Date | Status | Borrower | Loan Amount |
|---|---|---|---|
| Previous Owner | Frame Charles | $427,000 | |
| Previous Owner | Miller Sarah L | $166,000 |
Source: Public Records
Tax History Compared to Growth
Tax History
| Year | Tax Paid | Tax Assessment Tax Assessment Total Assessment is a certain percentage of the fair market value that is determined by local assessors to be the total taxable value of land and additions on the property. | Land | Improvement |
|---|---|---|---|---|
| 2026 | $10,106 | $1,251,780 | $250,500 | $1,001,280 |
| 2025 | $10,106 | $1,251,780 | $250,500 | $1,001,280 |
| 2024 | $9,657 | $1,251,780 | $250,500 | $1,001,280 |
| 2023 | $10,080 | $1,251,780 | $250,500 | $1,001,280 |
| 2022 | $8,912 | $941,460 | $200,770 | $740,690 |
| 2021 | $8,763 | $882,780 | $187,980 | $694,800 |
| 2020 | $8,260 | $819,560 | $173,920 | $645,640 |
| 2019 | $7,604 | $768,720 | $162,410 | $606,310 |
| 2018 | $7,408 | $691,590 | $127,880 | $563,710 |
| 2017 | $7,201 | $691,590 | $127,880 | $563,710 |
| 2016 | $6,503 | $592,270 | $139,810 | $452,460 |
| 2015 | $5,761 | $534,190 | $139,810 | $394,380 |
| 2014 | -- | $485,270 | $139,810 | $345,460 |
| 2013 | -- | $485,270 | $139,810 | $345,460 |
Source: Public Records
Map
Nearby Homes
- 13401 Manzanita Rd NE
- 13392 Hidden Cove Ln NE
- 7131 NE Bay Hill Rd
- 14433 Silven Ave NE
- 7870 NE Koura Farm Dr
- 8003 NE Hidden Cove Rd
- 7535 NE West Port Madison Rd
- 12170 Viewcrest Place NE
- 0 NE Lovgreen Rd E Unit NWM2419912
- 0 Ave N
- 11000 Xx State Hwy 305 NE
- 8484 NE County Park Rd
- 14855 Phelps Rd NE
- 9631 Summer Hill Ln NE
- 8552 NE Gordon Dr
- 9549 Olympus Beach Rd NE
- 9674 Olympus Beach Rd NE
- 9009 Miller Rd NE
- 16455 Agate Point Rd NE
- 12079 Sunrise Dr NE
- 12779 Manzanita Rd NE
- 12877 & 12861 Manzanita Rd NE
- 12877 Manzanita Rd NE
- 0 NE Day Rd W
- 12881 Manzanita Rd NE
- 12735 Manzanita Rd NE
- 12735 Manzanita Rd NE
- 12903 Manzanita Rd NE
- 12730 Manzanita Rd NE
- 12861 Manzanita Rd NE
- 12671 Manzanita Rd NE
- 12659 Manzanita Rd NE
- 13175 Manzanita Rd NE
- 12633 Manzanita Rd NE
- 6790 NE Day Rd W
- 12945 Manzanita Rd NE
- 13074 Manzanita Rd NE
- 12625 Manzanita Rd NE
- 12662 Manzanita Rd NE
- 6701 NE Day Rd W