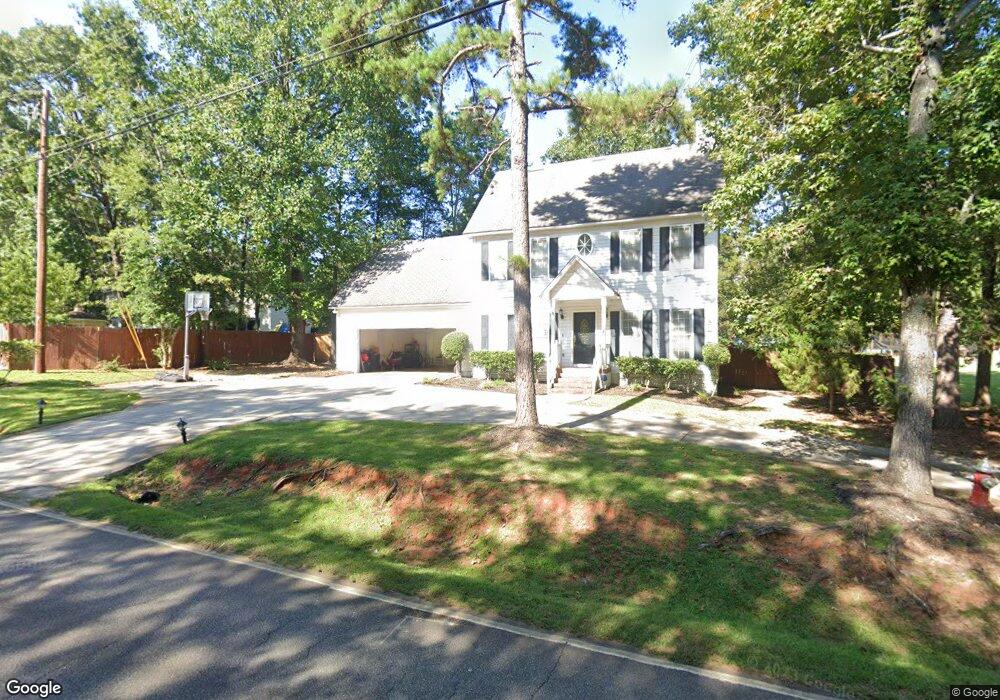
1288 Berl Mar Rd Columbia, SC 29212
Northwest Columbia NeighborhoodEstimated Value: $226,000 - $295,000
3
Beds
3
Baths
1,872
Sq Ft
$140/Sq Ft
Est. Value
About This Home
This home is located at 1288 Berl Mar Rd, Columbia, SC 29212 and is currently estimated at $262,449, approximately $140 per square foot. 1288 Berl Mar Rd is a home located in Lexington County with nearby schools including Irmo Elementary School, Irmo Middle, and Irmo High.
Ownership History
Date
Name
Owned For
Owner Type
Purchase Details
Closed on
Mar 3, 2021
Sold by
Rivers Thomas E and Rivers Hope E
Bought by
Jamison Anthony M and Jamison Sharon D
Current Estimated Value
Home Financials for this Owner
Home Financials are based on the most recent Mortgage that was taken out on this home.
Original Mortgage
$142,500
Outstanding Balance
$127,741
Interest Rate
2.7%
Mortgage Type
New Conventional
Estimated Equity
$134,708
Purchase Details
Closed on
Mar 23, 2001
Sold by
Sessions Ronald T
Bought by
Rivers Thomas E
Purchase Details
Closed on
Mar 16, 2001
Sold by
Collie Walker Const Co
Bought by
Walden Leroy D
Purchase Details
Closed on
Jun 29, 1999
Sold by
Nursery Hill Dev Corp
Bought by
Sessions Ronald T
Purchase Details
Closed on
Jun 14, 1999
Sold by
Sessions Ron
Bought by
Nursery Hill Dev Corp
Create a Home Valuation Report for This Property
The Home Valuation Report is an in-depth analysis detailing your home's value as well as a comparison with similar homes in the area
Home Values in the Area
Average Home Value in this Area
Purchase History
| Date | Buyer | Sale Price | Title Company |
|---|---|---|---|
| Jamison Anthony M | $150,000 | None Available | |
| Rivers Thomas E | $144,000 | -- | |
| Walden Leroy D | $85,000 | -- | |
| Sessions Ronald T | $118,559 | -- | |
| Nursery Hill Dev Corp | -- | -- |
Source: Public Records
Mortgage History
| Date | Status | Borrower | Loan Amount |
|---|---|---|---|
| Open | Jamison Anthony M | $142,500 | |
| Closed | Nursery Hill Dev Corp | -- |
Source: Public Records
Tax History Compared to Growth
Tax History
| Year | Tax Paid | Tax Assessment Tax Assessment Total Assessment is a certain percentage of the fair market value that is determined by local assessors to be the total taxable value of land and additions on the property. | Land | Improvement |
|---|---|---|---|---|
| 2024 | $1,114 | $6,769 | $1,600 | $5,169 |
| 2023 | $1,036 | $6,769 | $1,600 | $5,169 |
| 2022 | $1,045 | $6,769 | $1,600 | $5,169 |
| 2020 | $4,259 | $10,154 | $2,400 | $7,754 |
| 2019 | $4,067 | $9,394 | $2,400 | $6,994 |
| 2018 | $3,879 | $9,394 | $2,400 | $6,994 |
| 2017 | $3,848 | $9,394 | $2,400 | $6,994 |
| 2016 | $3,820 | $9,394 | $2,400 | $6,994 |
| 2014 | $985 | $6,840 | $1,400 | $5,440 |
| 2013 | -- | $6,840 | $1,400 | $5,440 |
Source: Public Records
Map
Nearby Homes
- 425 Silver Anchor Dr
- 2 Woodshaw Ct
- 279 Sheringham Rd
- 7841 Irmo Dr
- 271 Sheringham Rd
- 409 Castle Vale Rd
- 256 Sheringham Rd
- 2441 N Lake Dr
- 155 Doverside Dr
- 135 Shoals Landing Dr
- 139 Shoals Landing Dr
- 520 Sail Point Way
- 246 Merchants Dr
- 205 Palm Lake Dr
- 217 Palm Lake Dr
- 116 Trent House Rd
- 103 Cressfell Cir
- 105 Gaslight Ln
- 363 Silver Anchor Dr
- 106 Regency Place
- 28 Stonebriar Rd
- 24 Stonebriar Rd
- 29 Stonebriar Rd
- 1280 Berl Mar Rd
- 1283 Berl Mar Rd
- 20 Stonebriar Rd
- 1289 Berl Mar Rd
- 25 Stonebriar Rd
- 16 Stonebriar Rd
- 1263 Berl Mar Rd
- 21 Stonebriar Rd
- 17 Stonebriar Rd
- 1301 Berl Mar Rd
- 6 Stonebriar Rd
- 13 Stonebriar Rd
- 101 Tideland Ct
- 29 Carl Weed Ct
- 17 Stonebriad Rd
- 105 Tideland Ct
- 9 Stonebriar Rd